. 2023 Dec 1;12(1):48–59. doi: 10.1158/2326-6066.CIR-23-0350

Figure 2.

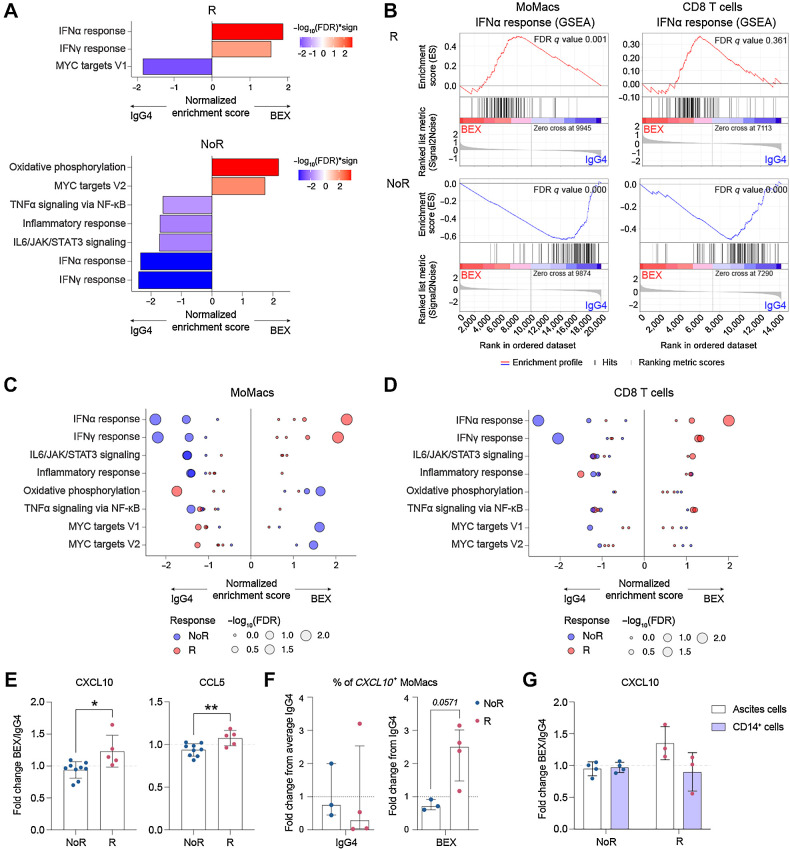
Figure 2. Bexmarilimab triggers IFN signaling and CXCL10 secretion in subsets of ovarian ascites TAMs. A, Bexmarilimab-induced changes in MoMac gene expression were analyzed by a GSEA separately in R (n = 4) and NoR (n = 3) group. Significantly altered pathways (FDR-adjusted q-value < 0.05) are shown. Red color indicates pathway upregulation by bexmarilimab treatment and blue color pathway downregulation. B, Enrichment plots showing IFNα response gene enrichment after bexmarilimab treatment separately in MoMacs and CD8+ T cells. Positive peaks indicate pathway upregulation and negative peaks downregulation. C and D, For significantly altered pathways presented in Fig. 2A, GSEA results from MoMacs (C) and CD8+ T cells (D) are displayed separately in each patient. Positive normalized enrichment scores indicate pathway upregulation by bexmarilimab, and negative score pathway downregulation. Dot color marks bexmarilimab response group and dot size increases with higher significance. E, Fold changes in indicated cytokines were measured from ovarian ascites cell culture supernatants after 48 hours of bexmarilimab treatment (n = 14 patients). Mean ± SD; unpaired t test; *, P < 0.05; **, P < 0.01. F, Percentage of CXCL10 expressing MoMacs was analyzed by scRNA-seq after 48 hours of IgG4 or bexmarilimab treatment. Median ± IQR, Mann–Whitney U test (NoR, n = 3; R, n = 4 patients). The bars correspond to following CXCL10+ MoMac proportions: 16.5% (NoR IgG4), 6.4% (R IgG4), 15.1% (NoR BEX) and 16.6% (R BEX). G, Fold change in CXCL10 was measured from ascites cell or CD14+ ascites cell culture supernatants after 48 hours of bexmarilimab treatment. Mean ± SD (NoR, n = 5; R, n = 3 patients). BEX, bexmarilimab; IgG4, isotype control for bexmarilimab.

Bexmarilimab triggers IFN signaling and CXCL10 secretion in subsets of ovarian ascites TAMs. A, Bexmarilimab-induced changes in MoMac gene expression were analyzed by a GSEA separately in R (n = 4) and NoR (n = 3) group. Significantly altered pathways (FDR-adjusted q-value < 0.05) are shown. Red color indicates pathway upregulation by bexmarilimab treatment and blue color pathway downregulation. B, Enrichment plots showing IFNα response gene enrichment after bexmarilimab treatment separately in MoMacs and CD8+ T cells. Positive peaks indicate pathway upregulation and negative peaks downregulation. C and D, For significantly altered pathways presented in Fig. 2A, GSEA results from MoMacs (C) and CD8+ T cells (D) are displayed separately in each patient. Positive normalized enrichment scores indicate pathway upregulation by bexmarilimab, and negative score pathway downregulation. Dot color marks bexmarilimab response group and dot size increases with higher significance. E, Fold changes in indicated cytokines were measured from ovarian ascites cell culture supernatants after 48 hours of bexmarilimab treatment (n = 14 patients). Mean ± SD; unpaired t test; *, P < 0.05; **, P < 0.01. F, Percentage of CXCL10 expressing MoMacs was analyzed by scRNA-seq after 48 hours of IgG4 or bexmarilimab treatment. Median ± IQR, Mann–Whitney U test (NoR, n = 3; R, n = 4 patients). The bars correspond to following CXCL10+ MoMac proportions: 16.5% (NoR IgG4), 6.4% (R IgG4), 15.1% (NoR BEX) and 16.6% (R BEX). G, Fold change in CXCL10 was measured from ascites cell or CD14+ ascites cell culture supernatants after 48 hours of bexmarilimab treatment. Mean ± SD (NoR, n = 5; R, n = 3 patients). BEX, bexmarilimab; IgG4, isotype control for bexmarilimab.