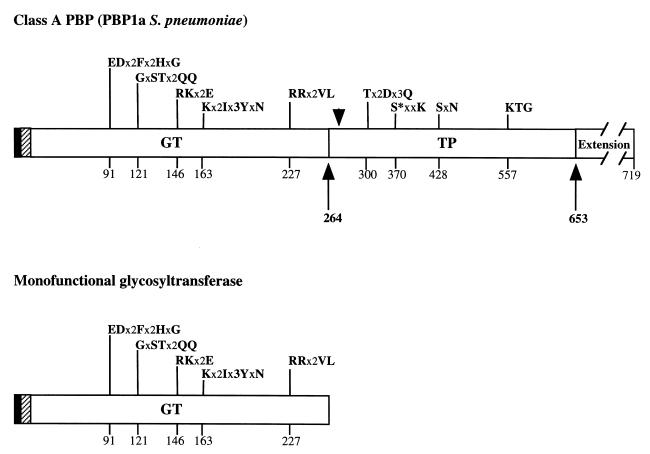
FIG. 1.
Comparison of the molecular organization of class A PBP and MGT. The filled and hatched boxes represent the N-terminal cytoplasmic region and the membrane anchor, respectively. The C-terminal Ser- and Asn-rich extension is also depicted in PBP 1a. GT and TP domains are represented together with their conserved motifs; active serine 370 is indicated by an asterisk. x represents any amino acid. The amino acid numbering is that of S. pneumoniae PBP 1a (19). The arrows delineate the proteolytic PBP 1a* TP domain. The arrowhead refers to the permissive site for insertion mutations in E. coli PBP 1b as described by Lefèvre et al. (16).

