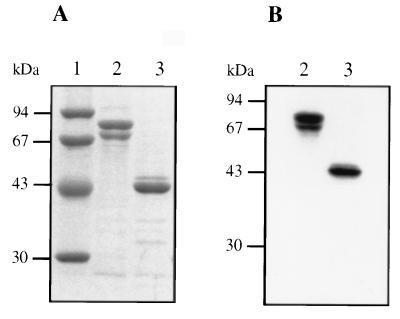
FIG. 5.
Analysis of purified PBP 1a* and TP. (A) Proteins were separated by SDS–12.5% PAGE and stained with Coomassie blue. (B) Autoradiogram of a dried SDS–12.5% PAGE of proteins (2 μg) labelled with [3H]benzylpenicillin prior to the migration. Numbers at the left indicate sizes of standard molecular mass markers. Lanes: 1, standard molecular mass markers; 2, PBP 1a*; 3, TP.

