Figure 2.
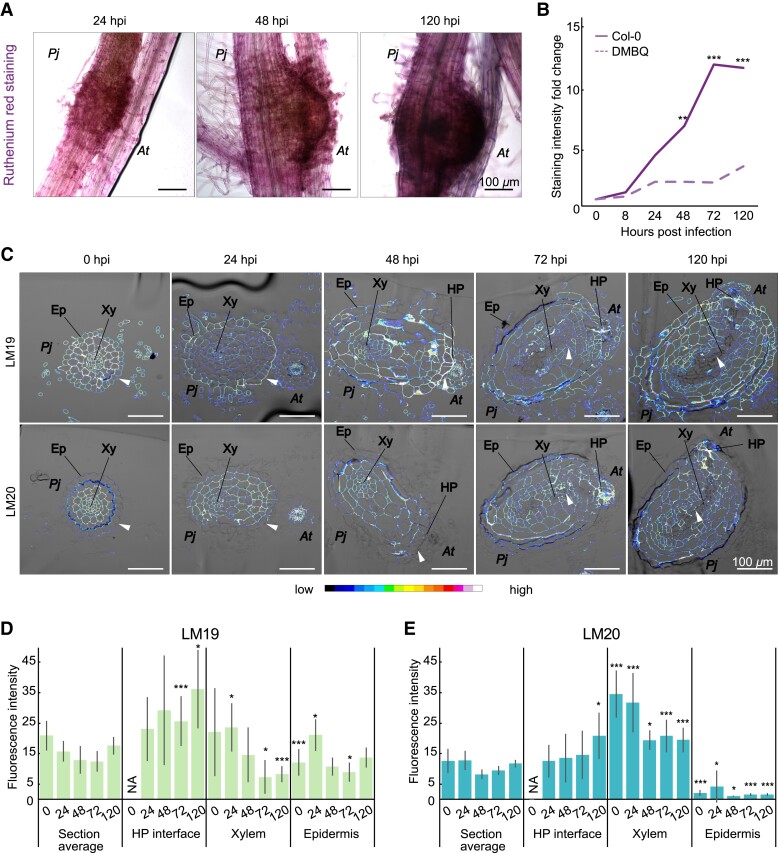
PME activity increases during haustorium development and is higher in intrusive cells. A) Ruthenium red staining of the developing haustoria at 24, 48 and 120 h post infection (hpi). Scale bars 100 μm. B) Quantification of staining intensity in infecting haustoria (solid line) or pre-haustoria formed on DMBQ (dashed line) during a time course from 0 to 120 hpi. Staining intensity normalized to 0 hpi. Asterisks indicate significant difference in staining intensity between haustoria and pre-haustoria at the same time point. (** P < 0.01, *** P < 0.001, Wilcoxon test, n = 11 to 20 roots, 1 replicate). C) Fluorescence images of antibody staining with LM19 (unmethylesterified homogalacturonan) and LM20 (highly methylesterified homogalacturonan) on P. japonicum (Pj) haustoria cross sections at 0, 24, 48, 72 and 120 hpi of A. thaliana (At). Arrowheads denote areas of differential staining between LM19 and LM20. Ep = epidermis, Xy = xylem, HP = host-parasite interface. D, E) Fluorescence quantification in whole P. japonicum sections (section average), host-parasite (HP) interface, xylem (root xylem and xylem bridge) and epidermis tissues for LM19 and LM20 antibodies. Asterisks indicate significant difference between a specific tissue and the section average at the same time point (Student's t-test, P-value corrected for multiple testing), bars represent standard deviation. Scale bars 100 μm; NA = tissue not present at the time point. * for P < 0.05, ** for P < 0.01, *** for P < 0.001, n = 3 to 15 sections.

