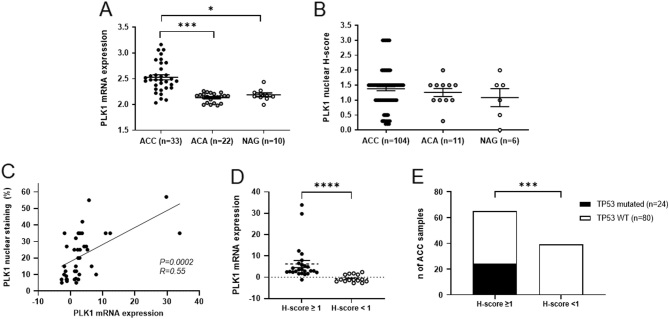
Figure 2.
PLK1 gene and protein expression in adrenal tumour samples. (A) PLK1 gene expression in a dataset of 33 adrenocortical carcinomas (ACCs), 22 adenomas (ACAs), and 10 normal adrenal glands (NAGs) from Giordano et al. (14). (B) Nuclear PLK1 staining evaluated by H-score in our cohort of 104 ACCs, 11 adrenocortical adenomas (ACAs), and 6 NAGs. P for trend = 0.697. (C) Relationship between PLK1 protein expression (percentage of positive nuclei) and gene expression levels in our cohort of 40 ACC samples. Statistics by linear regression analysis. (D) Relationship between PLK1 protein expression (H-score) and PLK1 gene expression levels in our cohort of 40 ACC samples. ****P< 0.0005. (E) Relationship between PLK1 protein expression (H-score) and presence of somatic mutations in TP53 gene (n = 104 ACC samples). ***P< 0.001.

 This work is licensed under a