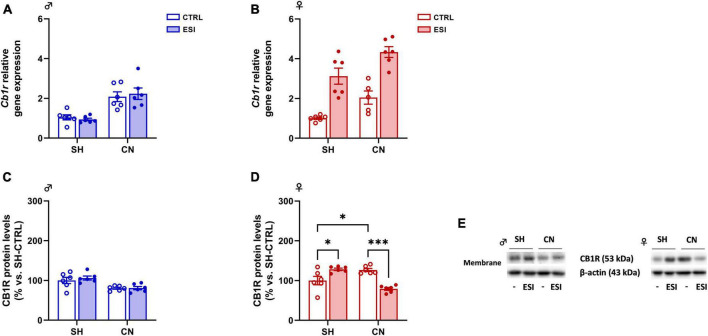
FIGURE 5.
Effect of early social isolation (ESI) and different housing conditions on CB1R gene and protein expression in the PFC of adolescent male (A,C) and female (B,D) rats. Gene expression data (A,B) represent 2–ΔΔCt values calculated by the ΔΔCt method and are expressed as mean ± SEM (n = 5–6/group; 1 outlier in CN-CTRL females). Protein levels (C,D) are shown in the cortical membrane fraction. Data are expressed as percentages of SH-CTRL male and female rats, respectively. Histograms represent the mean ± SEM (n = 6/group). Data were analyzed by two-way ANOVA followed by Tukey’s multiple comparisons test (*p < 0.05, ***p < 0.001). Representative immunoblots for CB1R protein levels (53 kDa) and β-Actin (43 kDa) are shown in panel (E).

