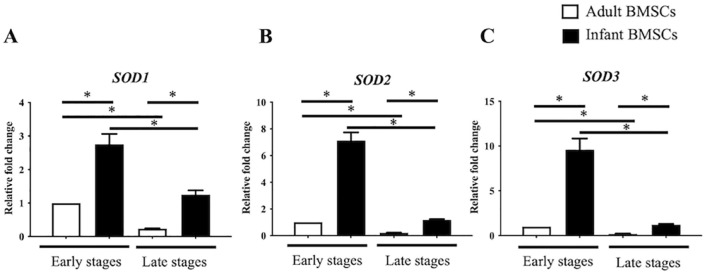
Figure 3.
Superoxide dismutase (SODs) expressions in adult and infant BMSC. The expression levels of (A) SOD1, (B) SOD2, and (C) SOD3 genes in adult and infant BMSCs at early passages (P3–P5) and late passages (P7–P9) were analyzed using RT-qPCR. The expression values were normalized to the reference gene glyceraldehyde-3-phosphate dehydrogenase (GAPDH). The mean ± standard error of the mean (SEM) calculated from three experimental replicates within both the infant and adult groups. Using the data from adult BMSCs in the early stage as the baseline, the relative fold change of adult BMSCs in the late stage and infant BMSCs in both early and late stages were calculated. The statistical comparisons of differences were individually analyzed using Mann–Whitney U analysis for the following groups: differences between adult and infant BMSCs in the early passage, differences between adult and infant BMSCs in the late passages, differences between adult BMSCs in the early and late stages, and statistical comparisons between infant BMSCs in the early and late stages. BMSC: bone marrow–derived mesenchymal stem cell; RT-qPCR: real-time quantitative polymerase chain reaction. The significance levels are indicated by *P < 0.05.

