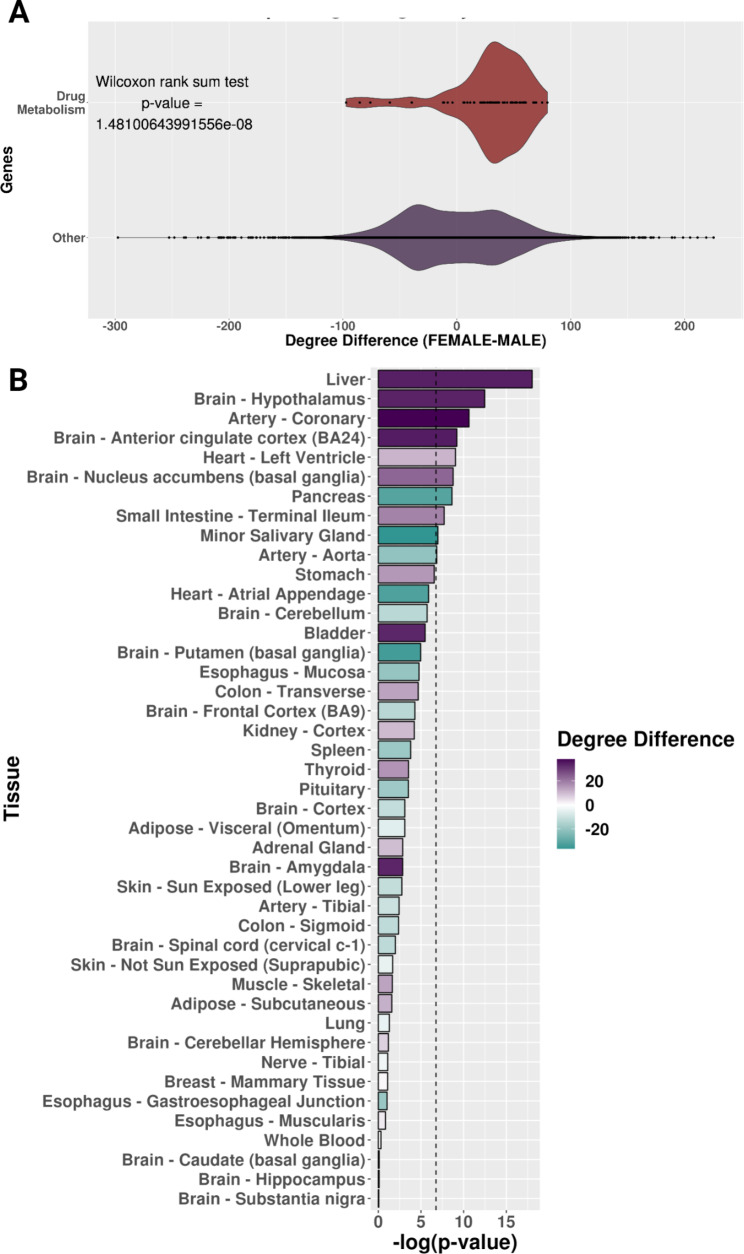
Fig. 3.
The neighborhood of sex-specific liver gene-regulatory networks around drug metabolism genes. (A) Degree difference distributions of the sex-specific liver networks for drug metabolism genes compared to all other genes. (B) Bar plot of the negative log-transformed p-value from the Wilcoxon test with colored bars showing the degree difference of drug metabolism genes between female and male sex-specific networks by tissue. For the bar plots, purple is a higher degree in female networks, and teal is a higher degree in male networks. The black dotted line is the p-value cutoff for the Bonferroni hypothesis test correction

