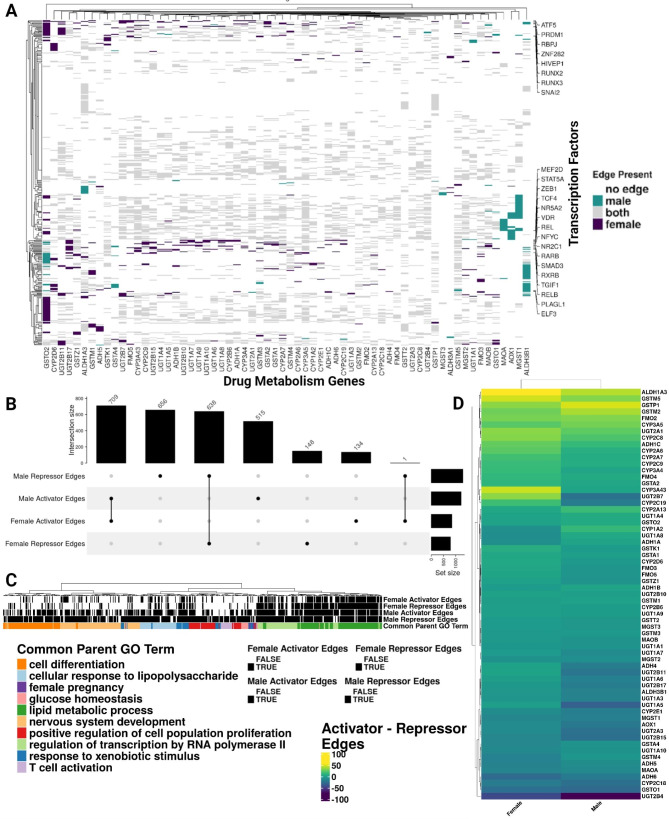
Fig. 4.
Predicted gene-regulatory relationships of drug metabolism genes in the sex-specific networks of the liver differ. (A) Heatmap of the male and female associated liver gene-regulatory edges of drug metabolism genes (x-axis) and transcription factors (y-axis). The coloring on the heatmap indicates the network(s) where an edge was present. The y-axis is annotated with the transcription factors with the most male or female edges. (B) Upset plot showing the intersection of activator and repressor transcription factor-gene edges in the female and male-specific liver networks. (C) A dendrogram of the enriched GO Biological Process terms of unique female and male activator/repressor edges. The “Common Parent GO Term[s]” clustering and selection were based on Wang’s semantic similarity. (D) A heatmap of the difference in activator and repressor edges of drug metabolism genes in the sex-specific liver networks (i.e., if the difference is positive, the drug metabolism gene is activator-targeted; if it is negative, it is repressor-targeted)

