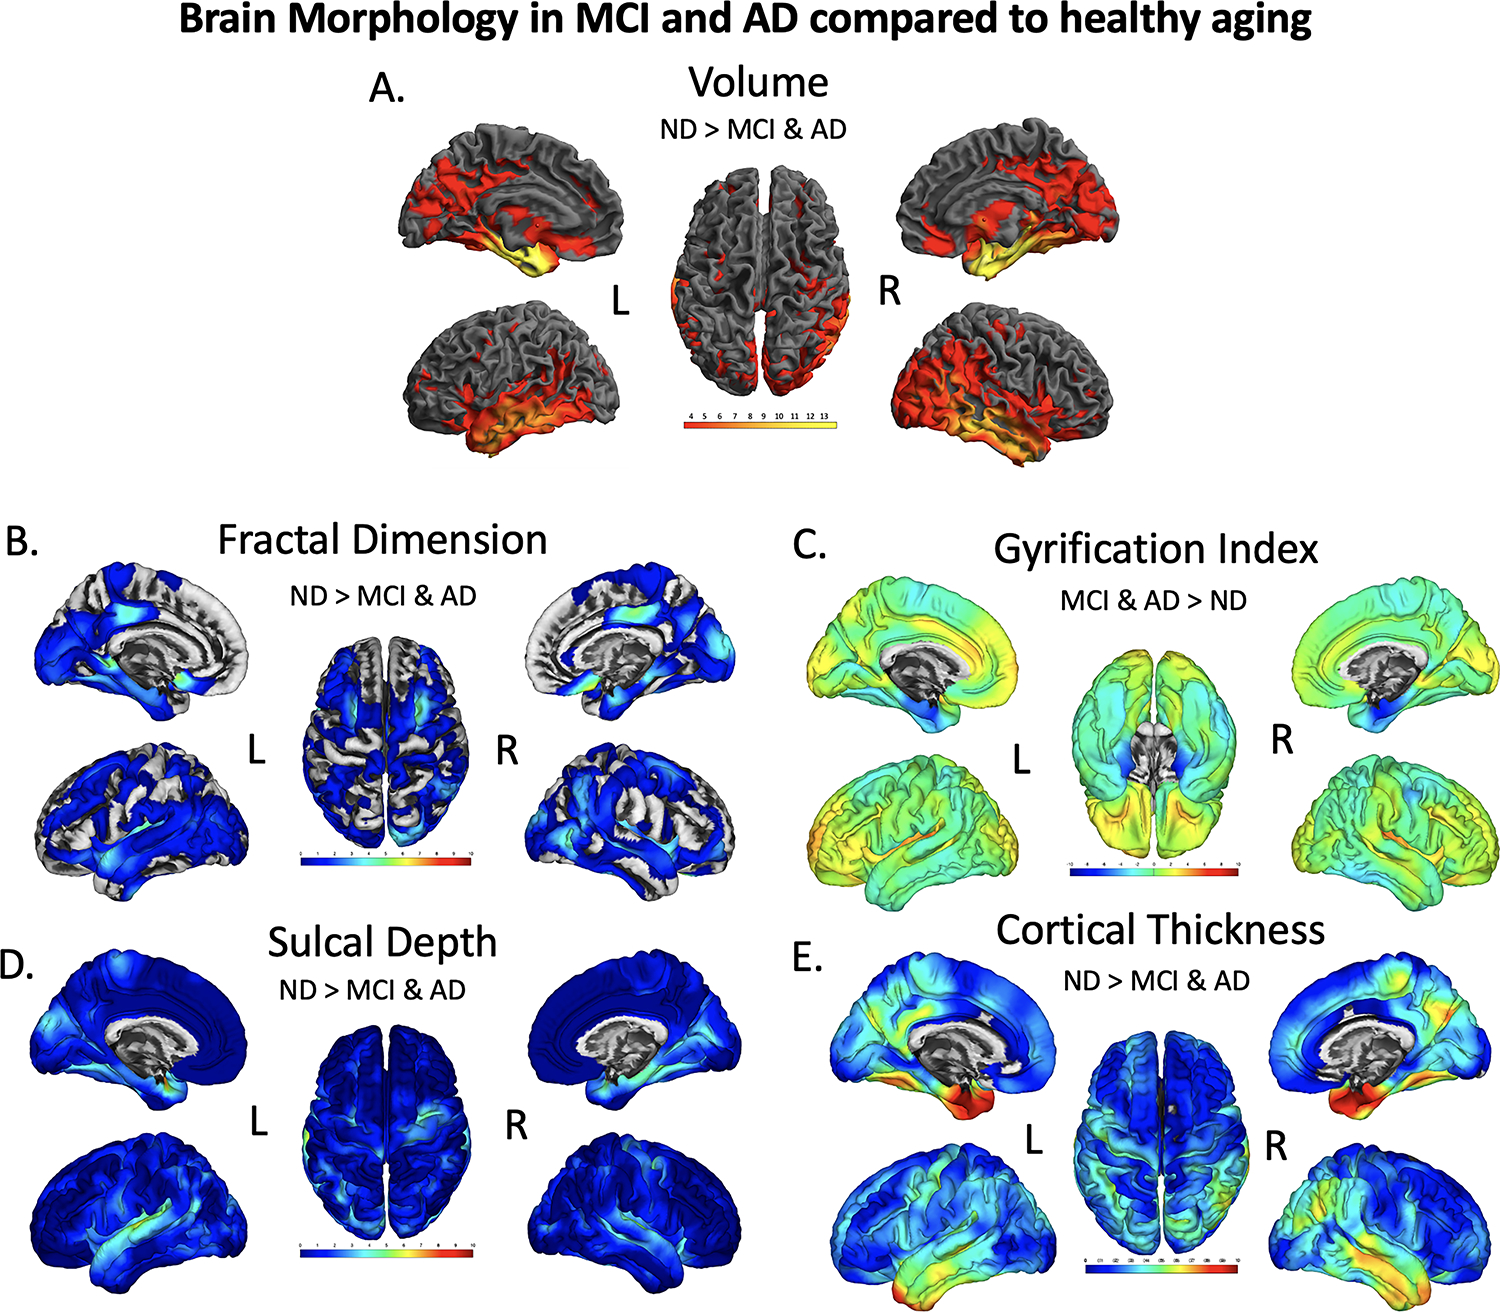
Figure 2.

Brain regions showing significant differences in volume (A), fractal dimension (B), gyrification index (C), sulcal depth (D), and cortical thickness (E), between CU and dementia groups. The results were FWE-corrected p<.05 with a cluster extent threshold of 100 voxels or vertices, controlling for age, sex, education and TICV (TICV was only used as a covariate in the Volume (A) analysis, not for surfaces). For Volume (A), yellow color indicates regions with a significant reduction volume in MCI/AD compared with CU, with a T-value of 3 being red and yellow being a 14 on the color bar. For fractal dimension (B), sulcal depth (D), and cortical thickness (E) a turquoise to yellow to red indicates the level of significance for a decrease in fractal dimension, sulcal depth, and cortical thickness in MCI/AD compared to CU. Gyrification index measures were found to be both significantly decreased (blue, bilateral parahippocampal gyrus)
