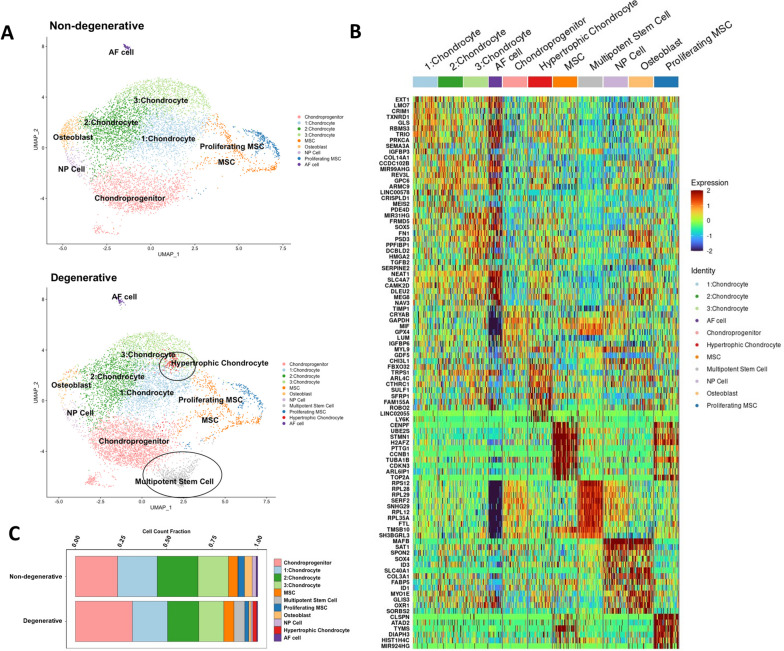
Fig. 3.
Single-cell RNA sequencing results. A Unsupervised clustering of non-degenerated (upper) and degenerated (lower) CEP samples reveals sample heterogeneity. Most clusters are shared between both samples, though hypertrophic chondrocyte and multipotent stem cell clusters were only present in the degenerated sample (black circles). Cluster annotations were determined from manually curated markers for different cell types predicted to reside within the CEP. B Heatmap of differentially expressed genes across all clusters. C A breakdown of the cellular composition of each sample, by percentage

