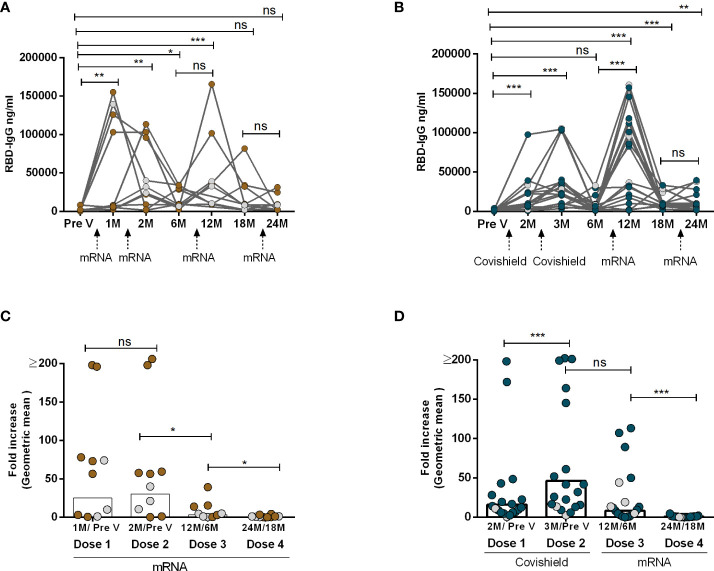
Figure 1.
IgG Antibody responses after two primary and two booster COVID-19 vaccination. RBD-specific IgG was analyzed in serum samples after four mRNA doses (A, C) and two primary Covishield and two booster mRNA doses (B, D) at different time intervals. Different doses of vaccine administration time points are indicated below the graphs. Samples were collected before vaccination (Pre-V), 1 month, 2/3 Months, 6 months, 12 months, 18 months, and 24 months after the first vaccination. Fold increase was calculated 1 month post-vaccination IgG conc. vs pre-vaccination IgG conc. for each dose as indicated in Figures (C, D). Each symbol represents one individual, and bars indicate geometric mean values. Symbols without any color represent participants who got infected before or after vaccination. Statistical analysis was performed between pre and post-vaccination using the Kruskal-Wallis test. *P <0.05, **P <0.01, ***P <0.001, ns, not significant; P >0.05.

