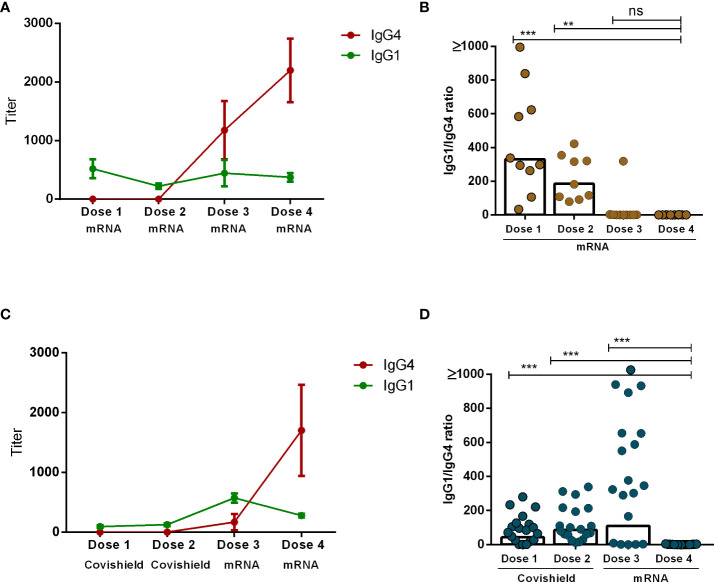
Figure 4.
Comparison between IgG1 and IgG4 subclasses after four different doses of COVID-19 vaccines. RBD-specific IgG1 and IgG4 antibodies (mean+SEM) are shown in line graphs after four mRNA doses (A) and two primary Covishield and two booster mRNA doses (C). IgG1 to IgG4 ratio was measured in individual participants one month after each vaccine dose are shown in graph (B, D). Each symbol represents one individual, and bars indicate geometric mean values. Statistical analysis was performed between pre and post-vaccination antibody titer using the Kruskal-Wallis test. **P <0.01, ***P <0.001, ns, not significant; P >0.05.

