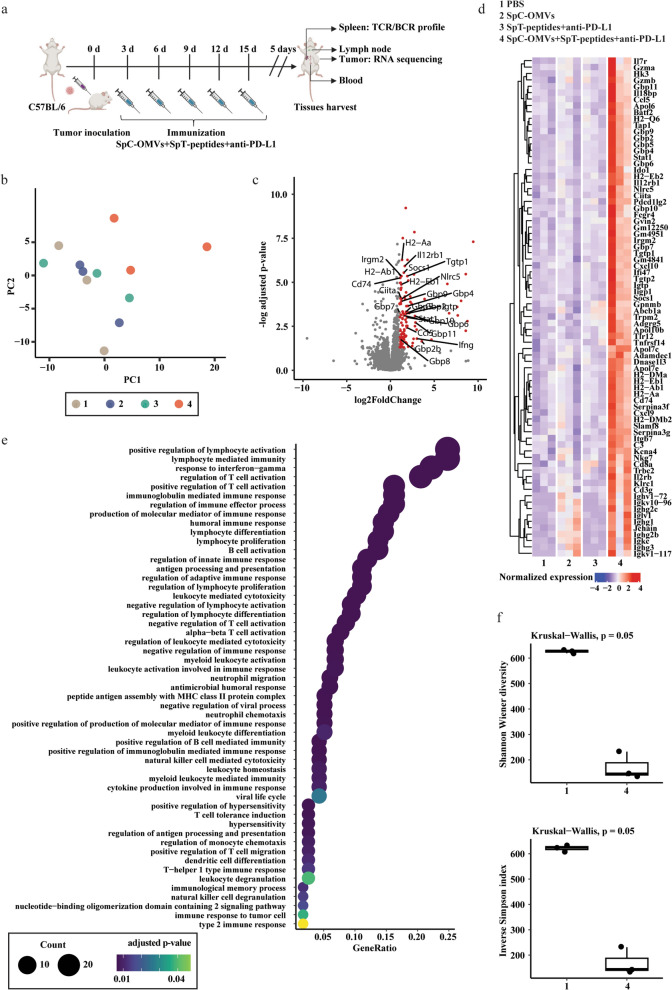
Fig. 5.
a Schematic illustration examining how OMV-PP inhibits bladder cancer growth. C57BL/6 mice were s.c. injected with MB49 cells in the right flank on day 0 and s.c. immunized on day 3, 6, 9, 12, and 15 for five total vaccinations. Mice were sacrificed 5 days after the final vaccination organ harvest. b Principal component analysis of RNA-Seq data. c Plots showing differentially expressed genes in group 4 compared to group 1. Dots in red indicate genes significantly upregulated in group 4. Significantly upregulated genes belonging to INF-γ response are labeled. d Heatmap plot showing the expression levels of upregulated genes in different groups. e Enriched gene ontology (GO) terms of significantly upregulated genes. f TCR-β repertoire diversities across groups 1 and 4. 1, PBS. 2, SpC-OMVs. 3, SpT-peptides + anti-PD-L1. 4, SpC-OMVs + SpT-peptides + anti-PD-L1

