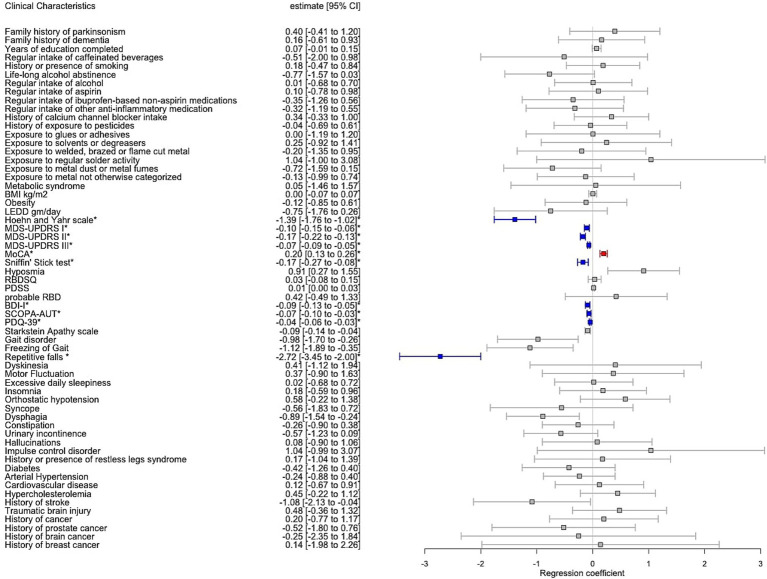
Figure 4.
Forest plot with results of multiple regression model including Parkinson’s disease individuals (PD) vs. progressive supranuclear palsy (PSP) adjusted for age at assessment, sex, disease duration and total languages spoken. Estimate corresponds to the regression coefficient with confidence interval 95% (CI). Significant associations after Bonferroni correction for multiple testing were annotated by an asterisk where red colour indicates positive significant association and blue colour negative significant association, respectively, between PD vs. PSP and the clinical variable.

