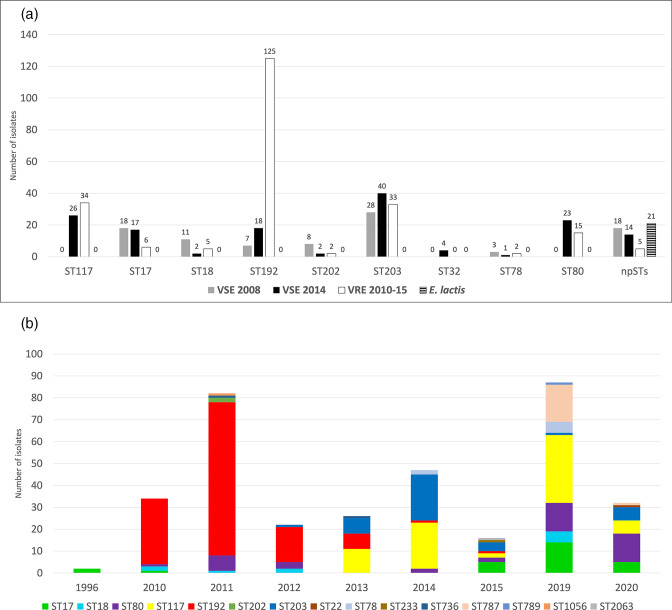
Fig. 2.
The frequencies of STs based on collection and year. (a) Frequencies of E. faecium STs shown per sample collection (VSE 2008, VSE 2014 and VRE2010–15) and of VSE E. lactis . The chart illustrates the STs containing at least 1 % of the total number of isolates in this study. STs with <1 % are shown together as non-prevalent STs (npSTs). (b) The prevalence of STs per year shown for VREfm. Data for 2019 and 2020 were added to compare shifts of STs from the period of the study (2010–2015) to more recent data (2019–2020).

