
Figure 2. Upward velocity and peak height as measures of changes in dopamine release with calcium.
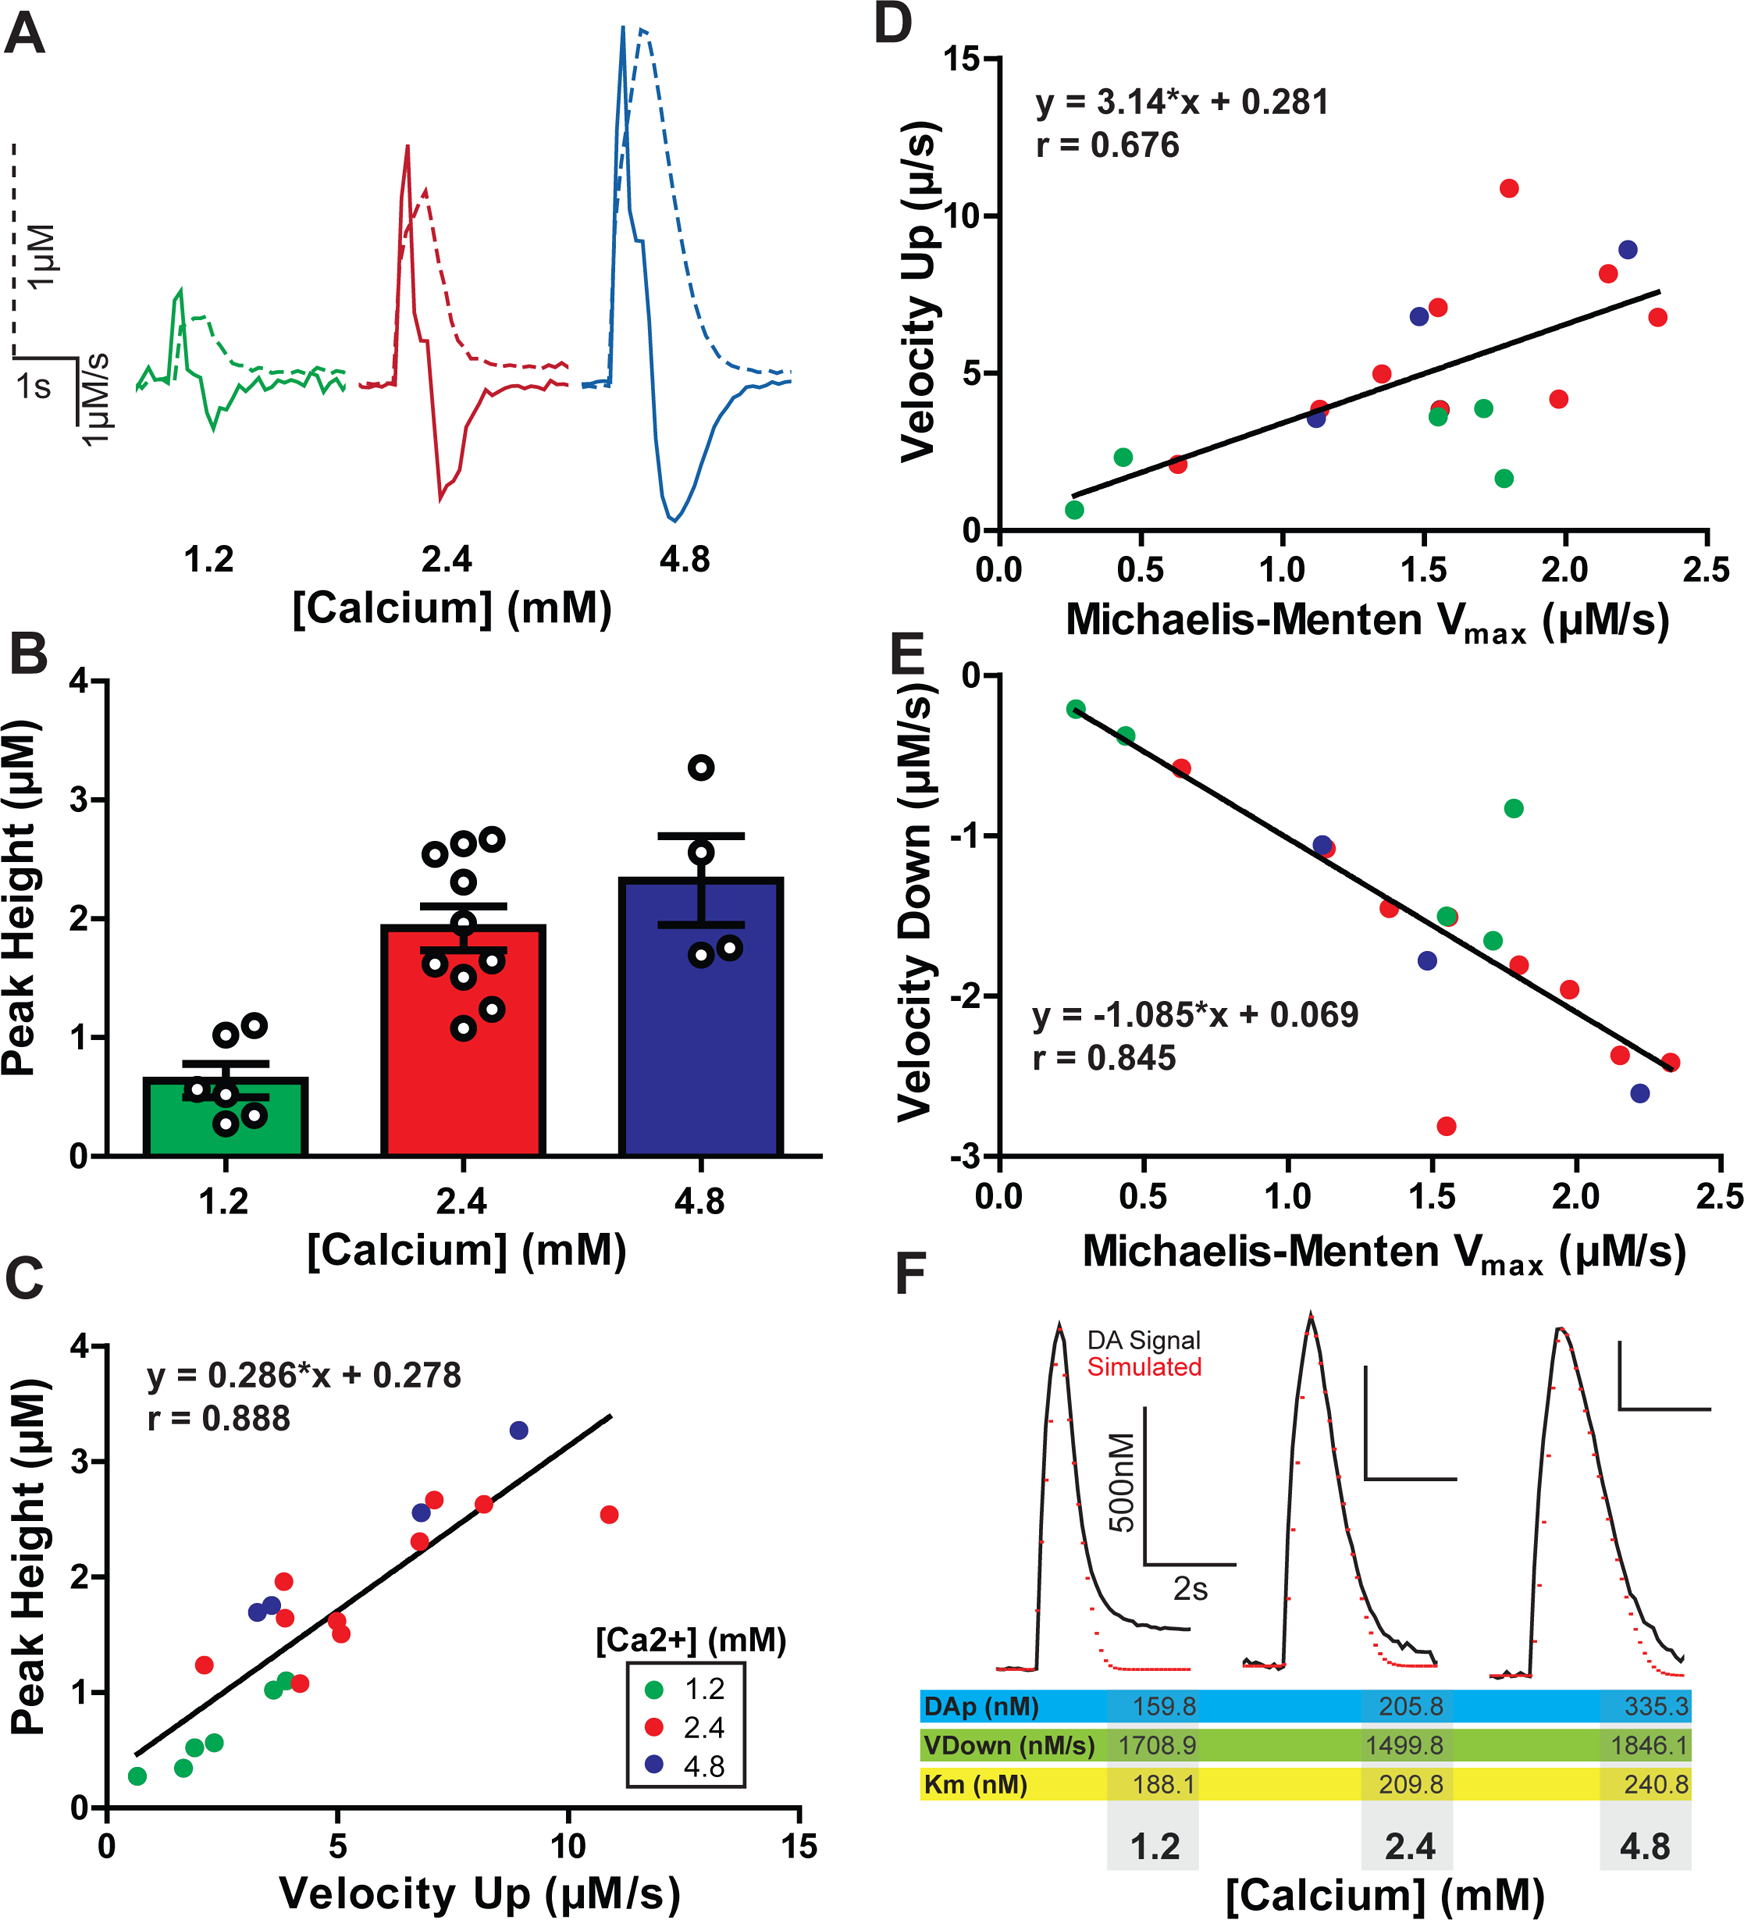
A) A comparison of example dopamine traces (dotted lines) overlaid with the corresponding first derivative (solid lines) at increasing concentrations of calcium. All traces are scaled identically. B) Maximal evoked dopamine concentrations (μM) at increasing concentrations of calcium (mM). C) Maximal upward velocity corresponds linearly with an increase in evoked dopamine release. Calcium concentrations for each measure are denoted by color. D) Upward velocity and E) downward velocity correlate with the Michaelis-Menten Vmax across all calcium conditions.
F) Voltammetry signals were modeled using Michaelis-Menten protocols where the maximal downward velocity was substituted for the Vmax value. Shown are three example traces (black) from each calcium condition overlayed with simulated modeled data (red) from these experiments. Below the traces are the Michaelis-Menten parameters obtained through modeling with downward velocity as the Vmax.