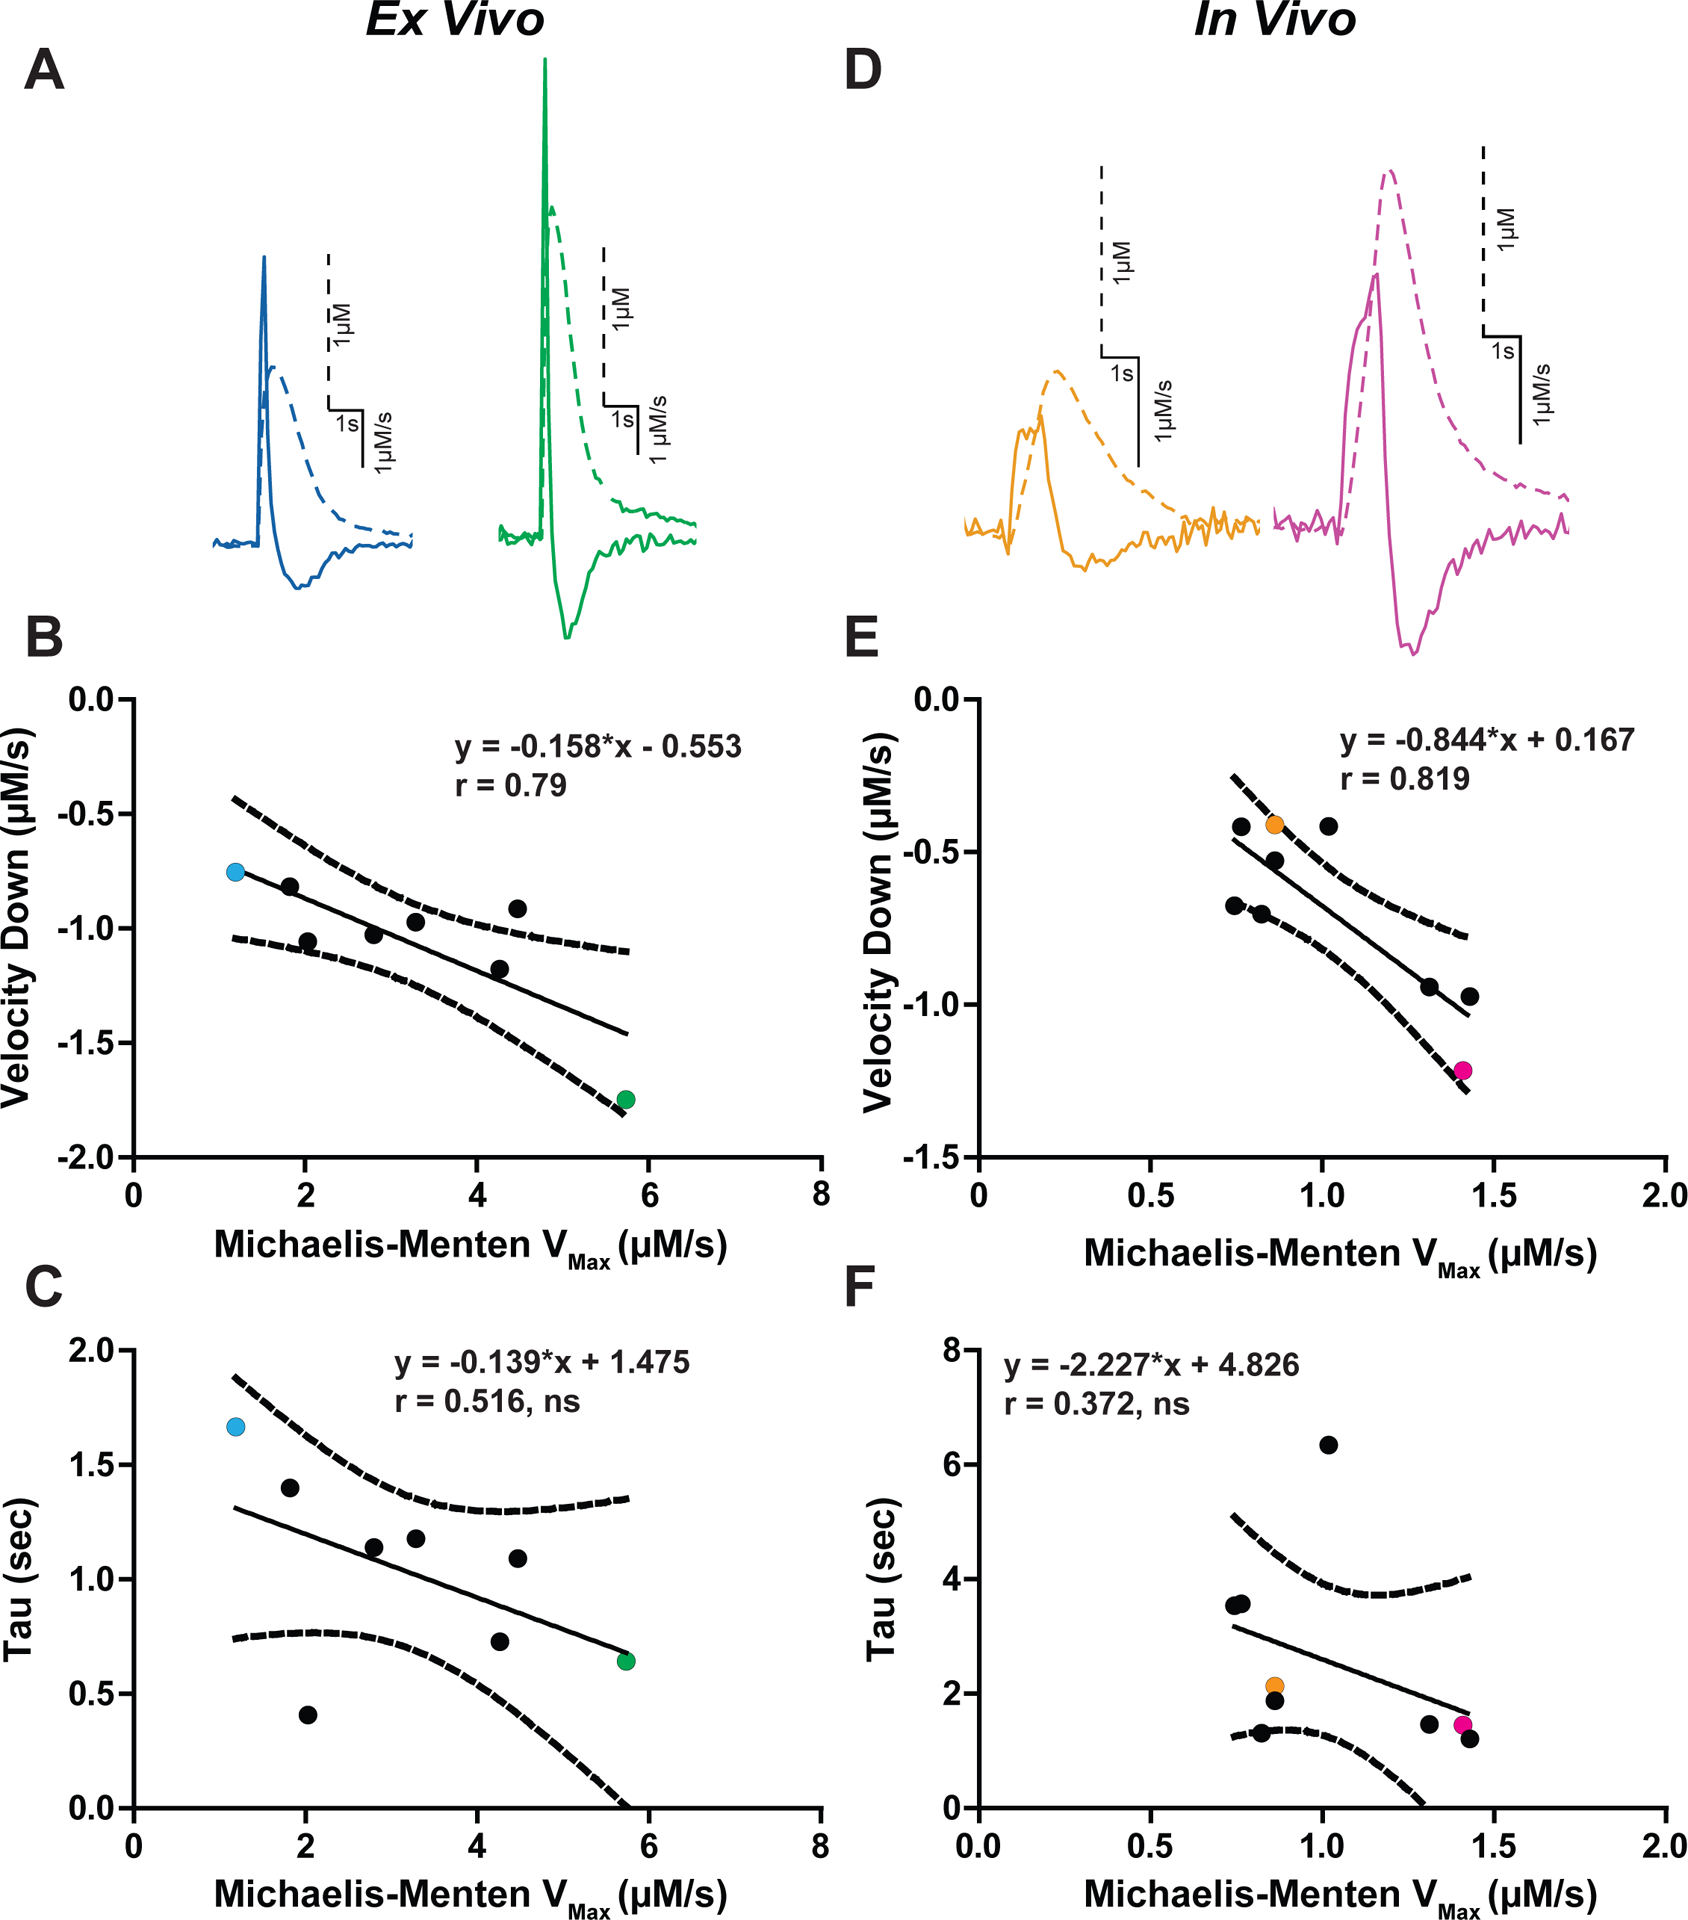
Figure 3. Downward velocity as a measure of dopamine transporter function.

Evoked dopamine traces from ex vivo (A) and in vivo (D) recordings. Traces are scaled individually. Dopamine concentration (dotted lines) and first derivative (solid line) are overlaid. Each trace is scaled individually. B) The Vmax obtained using the Michaelis-Menten model is plotted against the descending arm of the first derivative (Velocity Down). Each dot represents one experiment from ex vivo (B) and in vivo (E) experiments, with the colored dots corresponding to their respective colored traces in panels A and D. The exponential decay measure tau was examined against Vmax, and the two measures did not significantly correlate for ex vivo (C) and in vivo (F) experiments. (ns = not significant)
