
Figure 4. Upward velocity is not indicative of difference in uptake in DAT knockout mice.
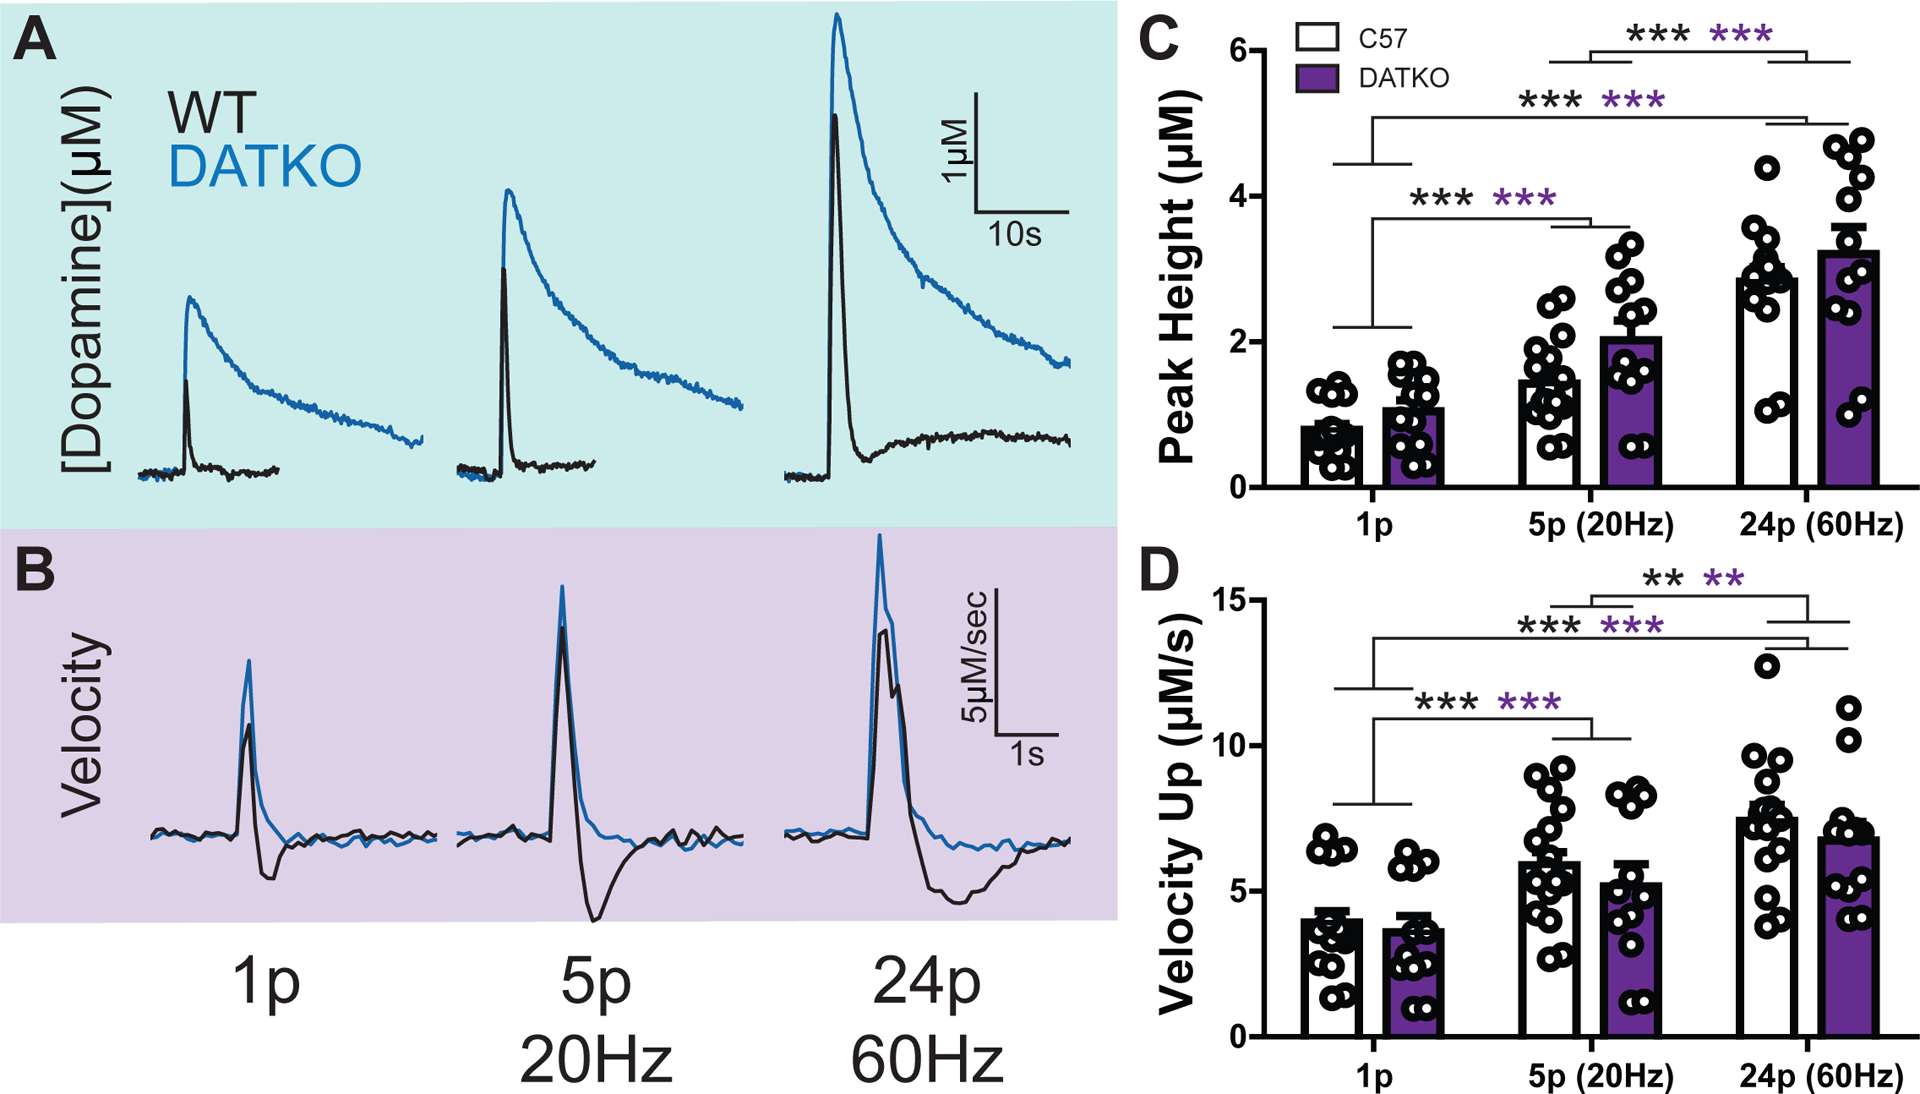
A) Evoked dopamine release concentrations compared between wild-type (black) and DAT knockout (blue) mice. Increasing pulse number and frequency induced higher release concentrations. Pulse protocols began with a single pulse (left), then increased to 5 pulses at 20 Hz (middle) and ended with 24 pulses at 60 Hz (right). B) The first derivative (velocity) of the dopamine traces in panel A. C) Average peak dopamine concentrations for the three pulse conditions. Each dot represents a single pulse event. D) First derivative maximum (peak velocity) for the three pulse conditions. Each dot represents a single pulse event. (** = p < 0.01; *** = p < 0.001)