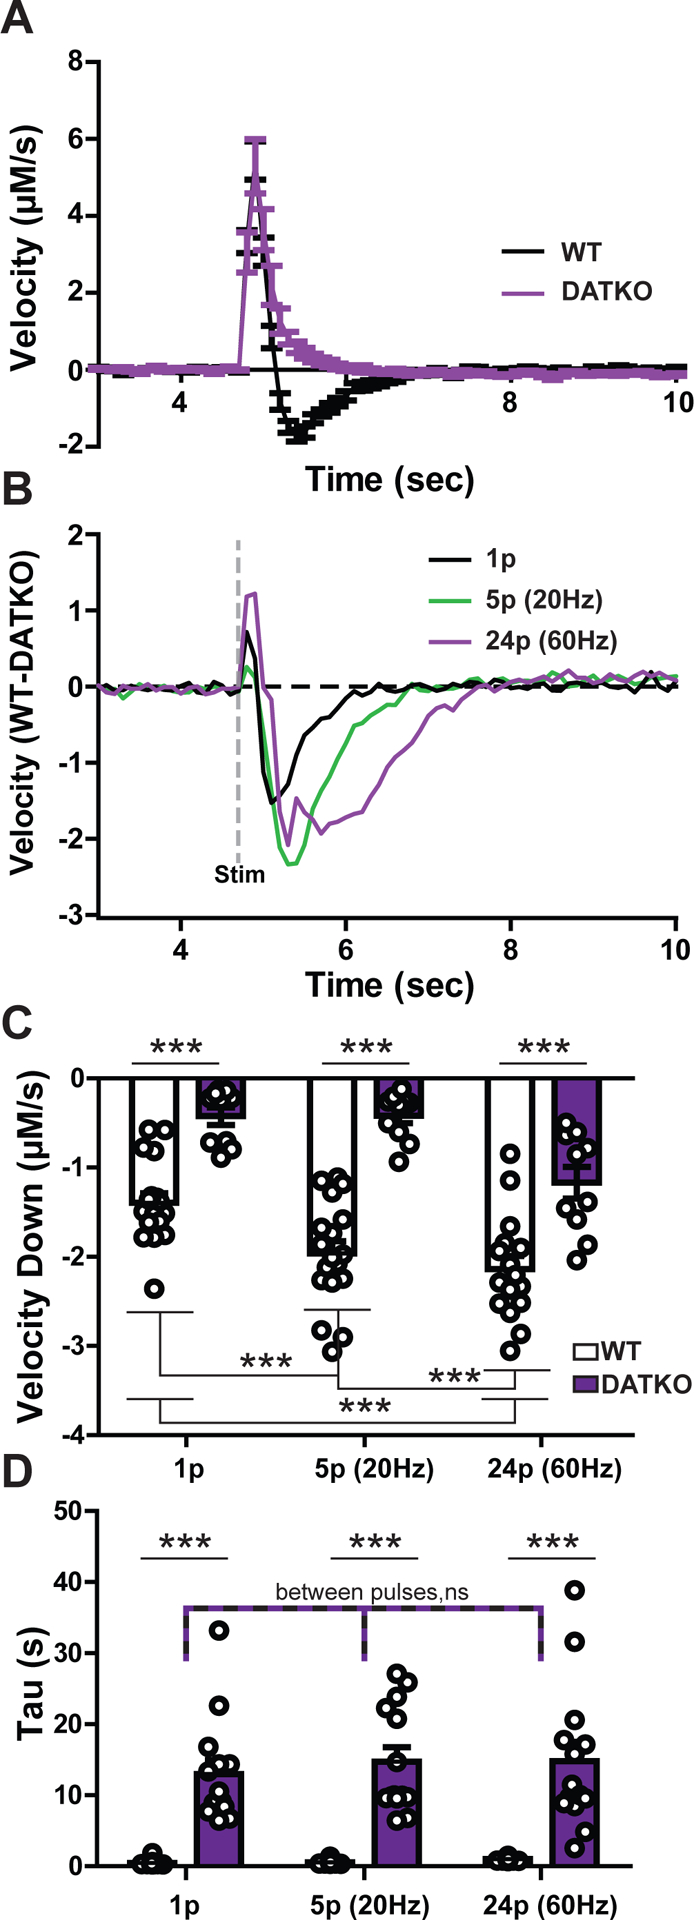
Figure 5. Downward velocity as a measure of dopamine clearance in DAT knockout mice.

A) A comparison of wild-type (black line) and DAT knockout (purple line) velocities obtained via the first derivative of dopamine concentration release under the single pulse condition. Note the slow decrease in DATKO compared to the negative values in the WT mouse. B) A subtraction plot of a first derivative trace in a WT mouse minus a trace from the DATKO mouse for each pulse condition. An electrical stimulation was delivered at 5 seconds as denoted by the dashed grey line. C) Average minima for the first derivative (peak velocity down) and D) exponential decay measure tau compared by mouse type and pulse condition. Each dot denotes a single dopamine release event. (*** = p < 0.001; ns = not significant)
