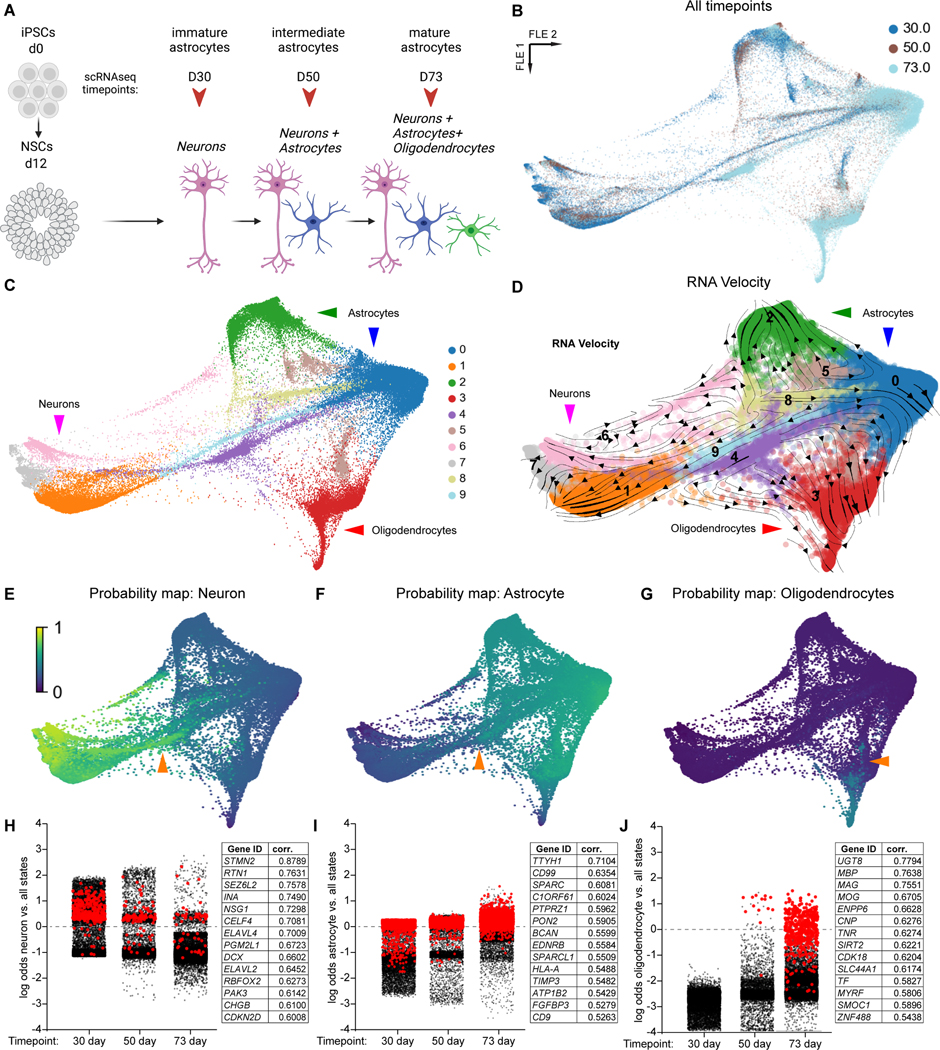
Figure 1. scRNAseq of human glial differentiation uncovers lineage-specific precursors and transient states.
A) Human differentiation schematic. B) Dimensional reduction of gene expression for all human data (43,506 cells) shown via force-directed graph (FLE). Each timepoint represents two independent replicates. C) FLE graph with cells clustered by gene expression using the Louvain algorithm (resolution: 0.3); mature cell types are identified with arrowheads. D) FLE graph with RNA velocity streamlines overlain, to depict flow of cell states over time based on splicing ratios for each gene. E-G) Probability maps for each mature cell type based on Waddington Optimal Transport (WOT) algorithm, scale represents the probability for each cell to eventually enter a given state. Orange arrowheads in E-F represent cells likely to become astrocytes or neurons; orange arrowhead in G represents cells likely to become oligodendrocytes. H-J) Log odds plots for each mature cell type based on WOT analysis. For every cell from each timepoint, the log odds to become a given cell type versus all other are plotted. In H, red cells express DCX > 3 (normalized expression); in I, red cells express TTYH1 > 3; in J, red cells express MOG > 3. Each panel also contains a table with the top 15 genes that had expression highly correlated with high probability for a given cell to enter a macrostate (see Methods).

