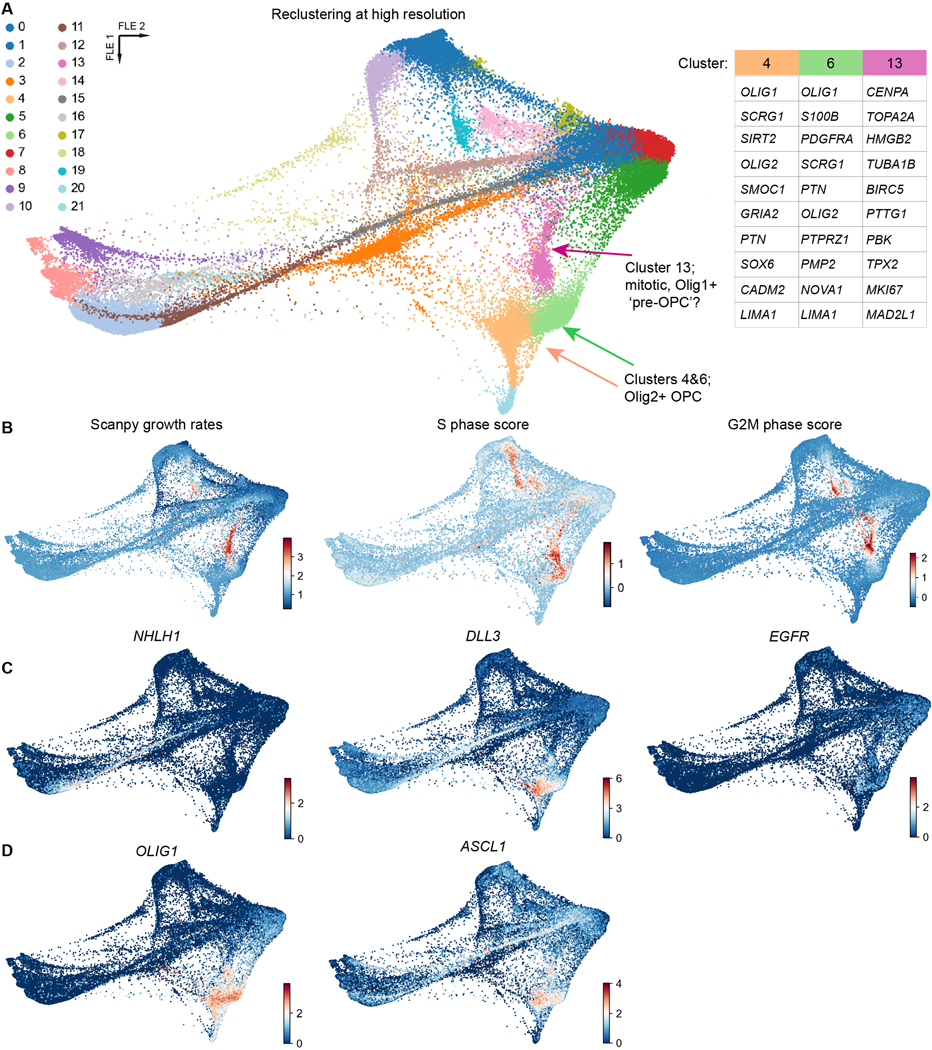
Extended Data Fig. 4. Reclustering and analysis of transient states in human glial differentiation.

a) FLE reduction of the same data from Fig. 1, reclustered at higher resolution (1.2). Marker genes for each of the clusters of interest are listed in the table to the right (see Results for further discussion), and the clusters are labeled with arrows on the FLE plot. b) Feature maps for mitotic scores from Scanpy70 (‘Scanpy growth rates’) and from scVelo30 (‘S phase score’ and ‘G2M phase score’). c) Feature maps for genes enriched in shared neuron/astrocyte precursors (NHLH1, DLL3, EGFR). d) Feature maps for genes enriched in astrocyte/oligodendrocyte precursors (OLIG2, ASCL1).
