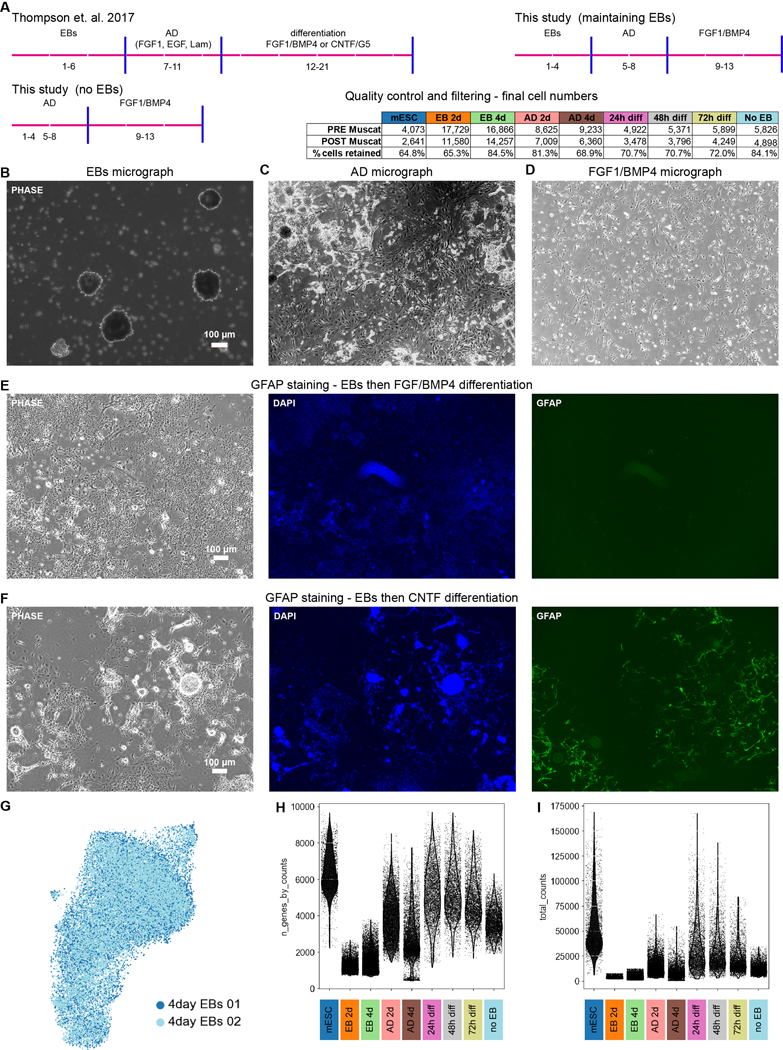
Extended Data Fig. 6. Differentiation overview and scRNAseq analysis metrics.

a) Mouse differentiation overview, with comparison across protocols. Quality control and pre/post filtering numbers for each mouse timepoint from the various protocols in table. b–d) Micrographs of cells during the embryoid body (EB), adherent differentiation (AD), and astrocyte growth factor stages. e, f) GFAP staining after protocol including EB stage. As expected based on published results22, (e) minimal GFAP staining is visible following treatment with FGF and BMP4 but (f) robust staining is visible after CNTF treatment. All images are representative from 3 independent differentiations g) Harmony integration of two independently harvested and processed samples from the same mouse timepoint (2 day EB) shows no evidence of batch effect. h) Number of genes identified for each cell and i) number of unique molecular identifier data for each cell from each timepoint.
