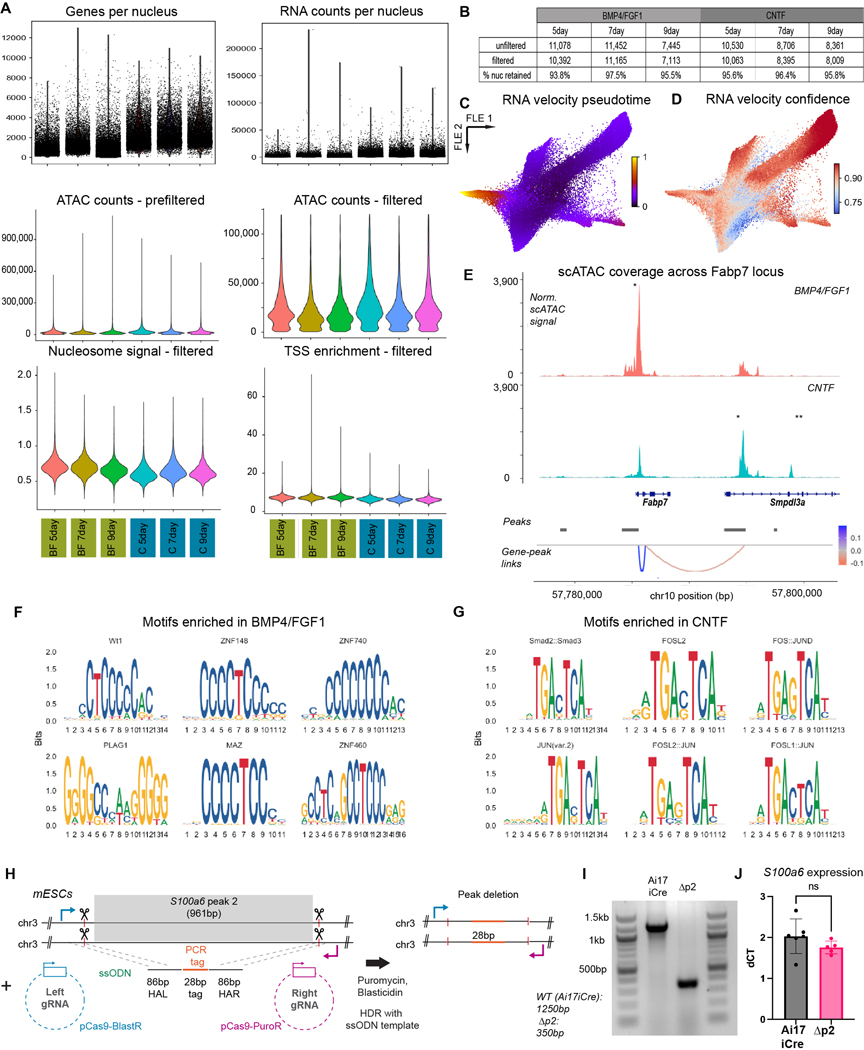
Extended Data Fig. 8. Multiomics quality control and genomic accessibility analyses.
a) Violin plots of genes and counts per nucleus (top row), ATAC counts pre/post filter (middle row), and nucleosome signal and transcription start site enrichment scores (bottom row) for each timepoint. b) Table of each sample included in dataset analyzed for Fig. 5. Nuclei were filtered based on the following cutoffs (see Methods): nCount_ATAC < 120000, nCount_ATAC > 500, nCount_RNA < 50000, nCount_RNA > 500, TSS.enrichment > 1. c) Pseudotime calculated based on the stochastic model of RNA velocity. d) Confidence in RNA velocity calculated for each cell based on local coherence of velocity vectors. e) Annotated coverage plot for Fabp7 locus. See Fig. 5f legend for detailed description of plot. f, g) Transcription factor motifs detected as enriched in peaks that were differentially accessible in BMP4/FGF1 (f) or CNTF (g) conditions. h) Approach for peak deletion for multiomic validation. i) Agarose gel demonstrating successful deletion of peak #2 and replacement with single-stranded oligo-donor nucleotide (ssODN) template. j) No differences in S100a6 gene expression between the unedited (Ai17iCre) and the edited, peak #2 deleted (Δp2) mESC lines as measured by quantitative PCR. N = 6 biologically independent wells from 2 separate differentiations, two-sided t-test with no multiple comparisons, data are plotted as mean ± s.e.m.

