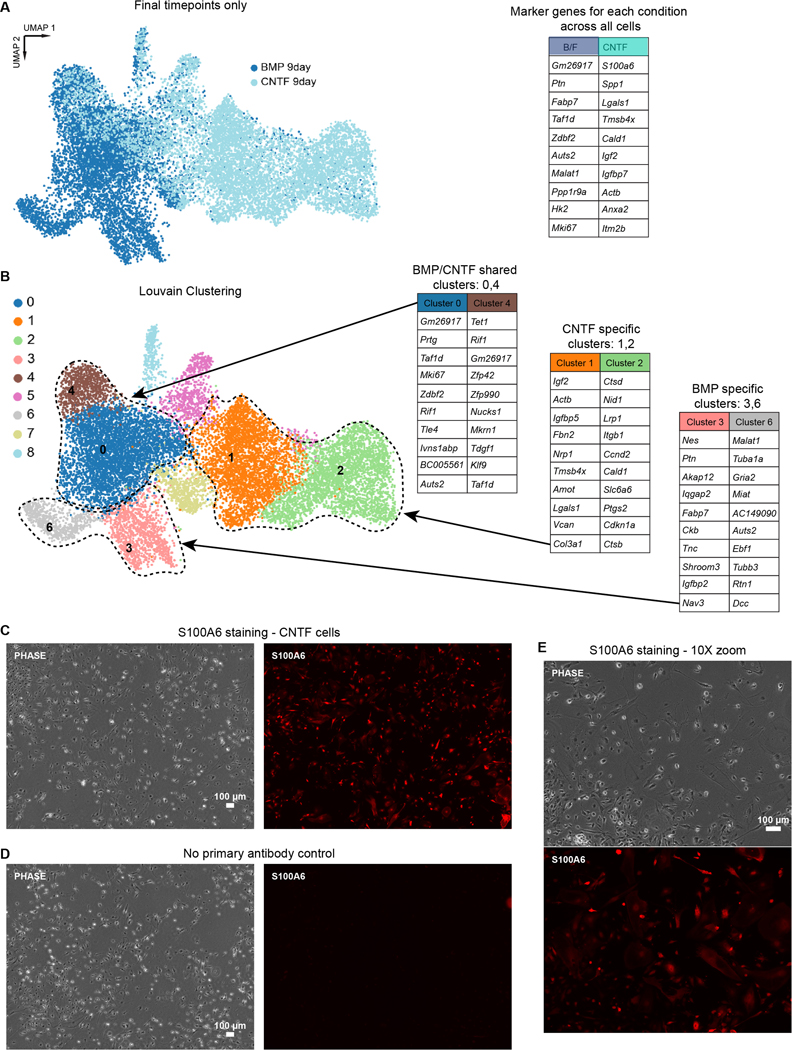
Extended Data Fig. 9. Analysis of gene expression final timepoint from each growth factor time series.
a) (Left) Dimensional reduction of gene expression data from final timepoints. (Right) Top 10 genes positively enriched in cells belonging to one growth factor versus the other, as calculated in Scanpy. b) Louvain clustering of data from (a) identifies multiple clusters of cells based on gene expression that are either shared by both growth factor conditions (clusters 0,4), unique to BMP4/FGF1 condition (clusters 3,6), or unique to the CNTF condition (clusters 1,2). Top 10 marker genes for the above clusters are listed to the right. c–e) Validation of gene expression results with S100A6 immunostaining in cells from the final CNTF timepoint. Representative images from 3 independent differentiations.

