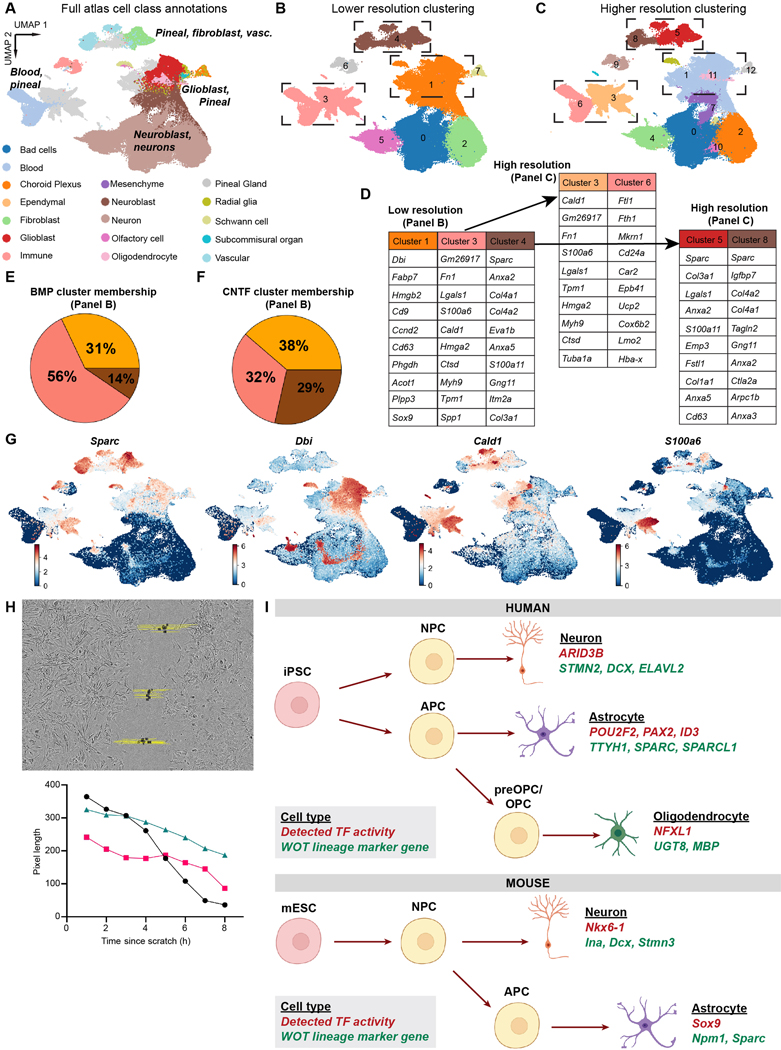
Extended Data Fig. 10. Primary atlas integration, marker genes, and functional testing quality controls.
a) Cell class annotations were plotted from cell atlas metadata, and plotted for all 93,894 cells from the atlas. b) Cells were initially clustered at low resolution (0.1); reprint of Fig. 6c for ease of comparison. c) Cells were clustered at higher resolution (0.3). d) Top marker genes for select clusters (dashed lines) from Extended Data Fig. 10b,c that contain both primary cells and differentiated cells. Marker genes for subclusters emerging from either Cluster 3 (left) or Cluster 4 (right) as part of re-clustering at higher resolution. e, f) Pie chart of percentage of cells from the BMP or CNTF 9 day timepoints (BMP: 7445 total, CNTF: 8361 total) that belong to each cluster from (b). g) Feature plots for major marker genes in panel (d). h) Top: Still image from Supplementary Video 1 with example of scratch quantification. Bottom: Graph of scratch closure over time from one well. i) Graphical summary of findings from the human datasets (top) and mouse datasets (bottom).

