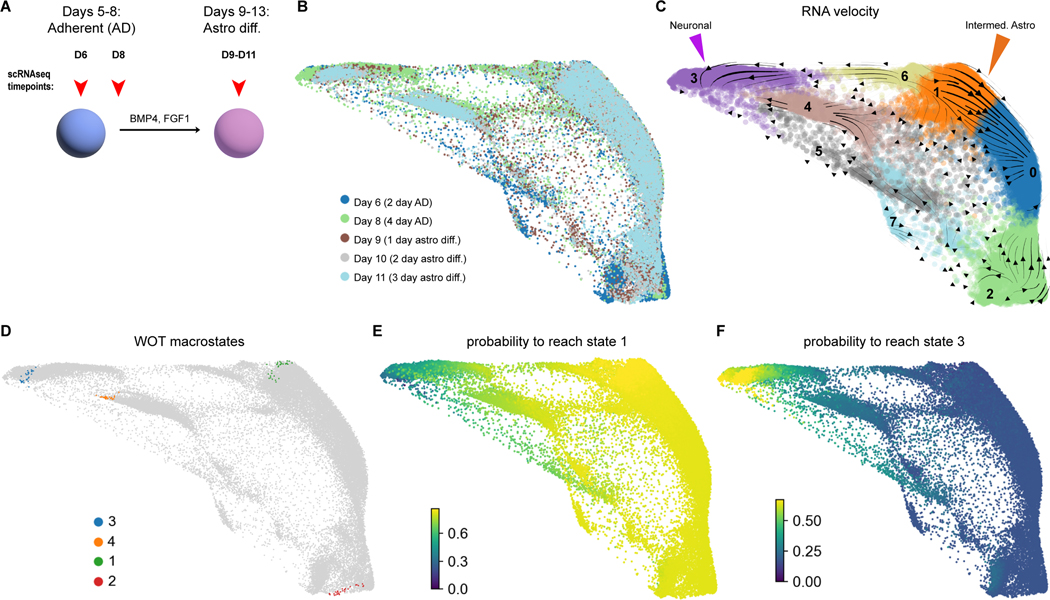
Figure 3. Analysis of subsets of early mouse astrocyte differentiation.
A) Schematic of mouse data subset and reanalyzed for this figure. B) Force-directed graph (FLE) plot of reclustered, subset data colored by batch. C) FLE graph with RNA velocity streamlines depicts flow of cell states over time based on splicing ratios for each gene. Neuronal (purple) and intermediate astrocyte (orange) fates are depicted with arrowheads. D) FLE graph of the 4 macrostates identified by WOT analysis of this data subset. E,F) Probability maps for each mature cell type based on the WOT algorithm, scale represents the probability for each cell to eventually enter a given state (state 1 [intermediate astrocyte] or 3 [neuron]).

