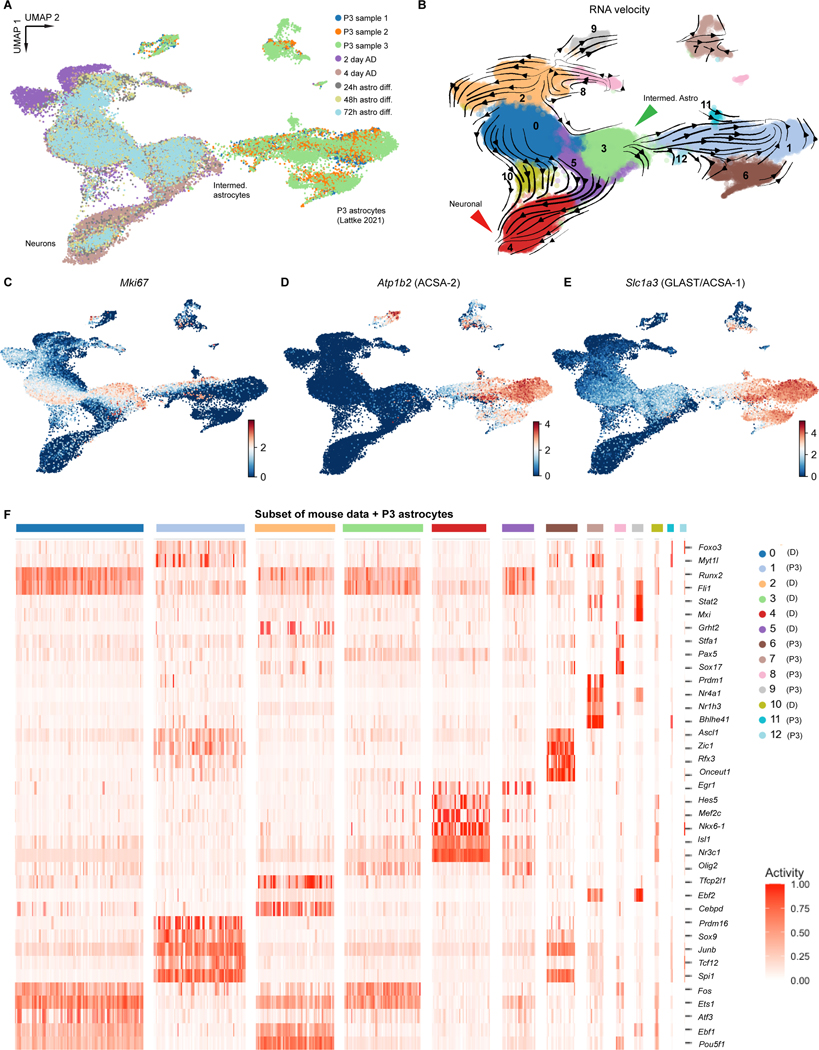
Figure 4. Comparison of putative cell surface marker gene expression patterns in differentiated and primary cells.
A) Uniform Manifold Approximation and Projection (UMAP) of later mouse differentiation timepoints integrated via Harmony with published postnatal day 3 (P3) mouse astrocyte data. B) RNA velocity streamlines are overlain on UMAP with Louvain clusters colored for the integrated data (clustering resolution: 0.6). C) Feature plot of Mki67 expression depicts likely mitotic cells across both datasets. D) Feature plots of Atp1b2, the gene for the surface protein ACSA-2 used to enrich for astrocytes in the original P3 dataset. Clear heterogeneity of ACSA-2 expression is visible across both datasets. Feature plots for Sox9 expression, an early astrocyte precursor marker. E) Feature plot for Slc1a3 expression shows medium levels of expression in astrocyte-like differentiating cells, but not in the neuronal-like cells. F) Heatmap of BITFAM detected activities for each cluster from panel B (later mouse differentiation timepoints with P3 primary astrocyte data). Clusters are colored on the x-axis corresponding to panel B (legend to the right; D: from differentiated cells, P3: from primary P3 cells), and TFs with detected activity are on the y-axis. P3 data obtained from23

