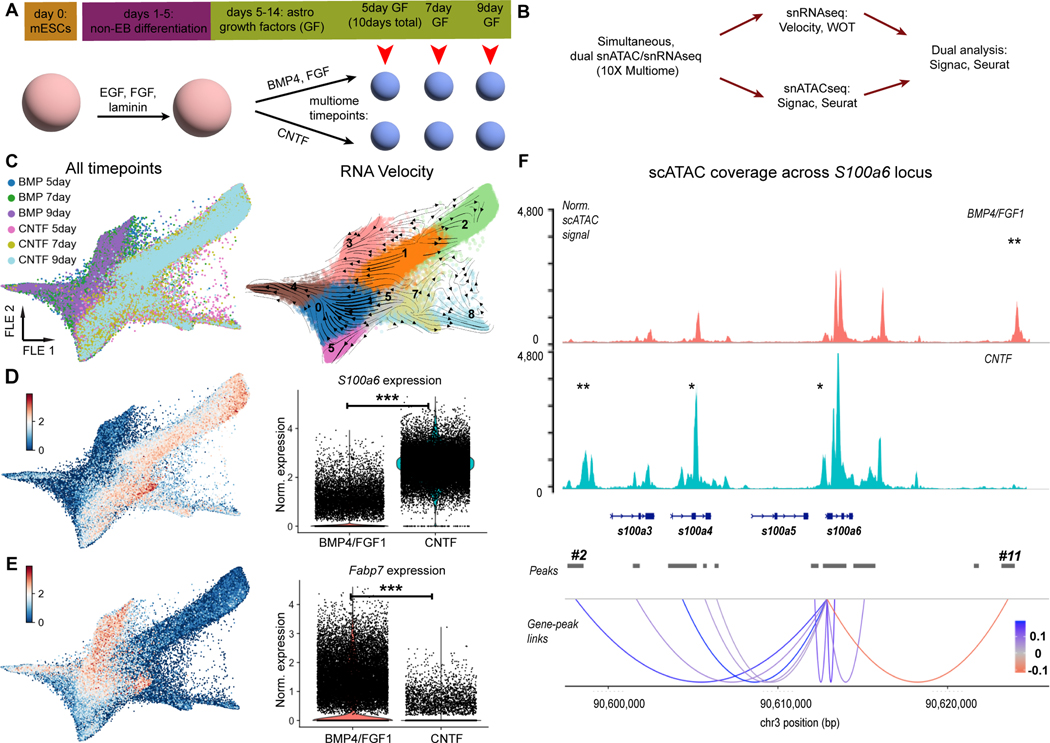
Figure 5. Multiomic analysis of two different astrocyte differentiation time series.
A) Schematic of modified, no-EB mouse astrocyte differentiation protocol. Time points used for multiomic analysis are marked. B) Bioinformatic analysis workflow for multiomic data processing. C) (left) Force-directed graph (FLE) of gene expression from 55,137 nuclei collected for multiomic analysis, from 6 time points. See Extended Data Fig. 8 for quality control information. (right) FLE graph with RNA velocity streamlines overlain, to depict flow of cell states over time based on splicing ratios for each gene. Cells were clustered with the Louvain algorithm (resolution: 0.6); clusters are labeled by number on the plot. D,E) Feature plots and violin plots of marker gene expression for either the BMP4/FGF1 (S100a6; D) or CNTF (Fabp7; E) conditions. *** p < 0.001; differential expression testing via Wilcoxon ranked-sum test as implemented in Seurat. F) (top panel) Plot of normalized pseudobulk scATAC signal for all cells from each growth factor condition. Peaks are labeled with one asterisk if they have increased signal in one condition versus the other, or two asterisks if the peak is only present in one condition versus the other. (bottom panel) scATAC signal was grouped into peaks using the MACS2 algorithm (see Methods), and peaks were then correlated with gene expression. Correlation scores are highlighted with colored lines in the “Gene-peaks links” panel. Gene body diagrams are from ENSEMBL, as implemented in the “coverage_plot” command in Signac.

