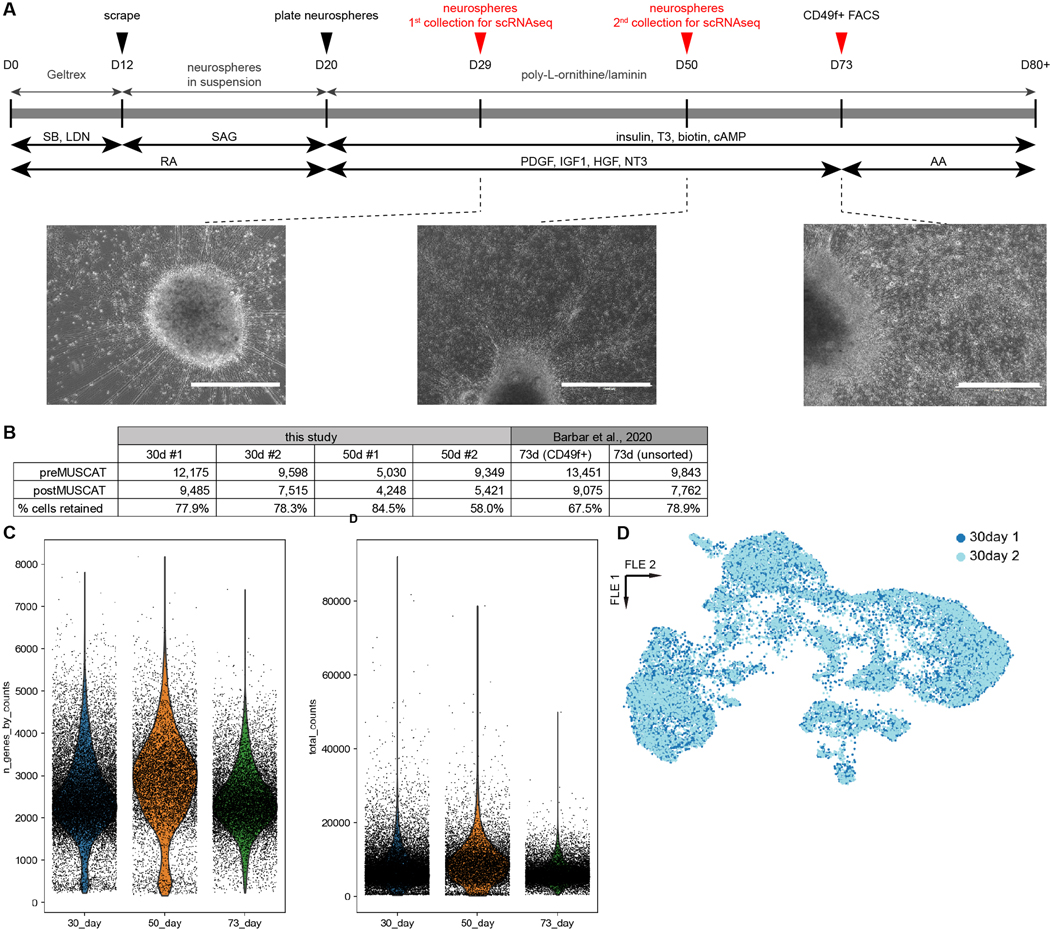
Extended Data Fig. 1. Differentiation overview and scRNAseq analysis metrics.
a) Detailed human differentiation overview, with phase contrast micrographs of cells at the timepoints analyzed via scRNAseq. Representative images from 3 independent differentiations. b) Table of quality control processing statistics for the data produced in this study and for the reanalyzed data from20. c) Number of genes identified for each cell and number of unique molecular identifier data for each cell. d) Harmony integration of two independently harvested and processed samples from the same human timepoint (30day) shows no evidence of batch effect. SB = SB431542, LDN = LDN193189; SAG = smoothened agonist; RA = retinoic acid; AA = ascorbic acid.

