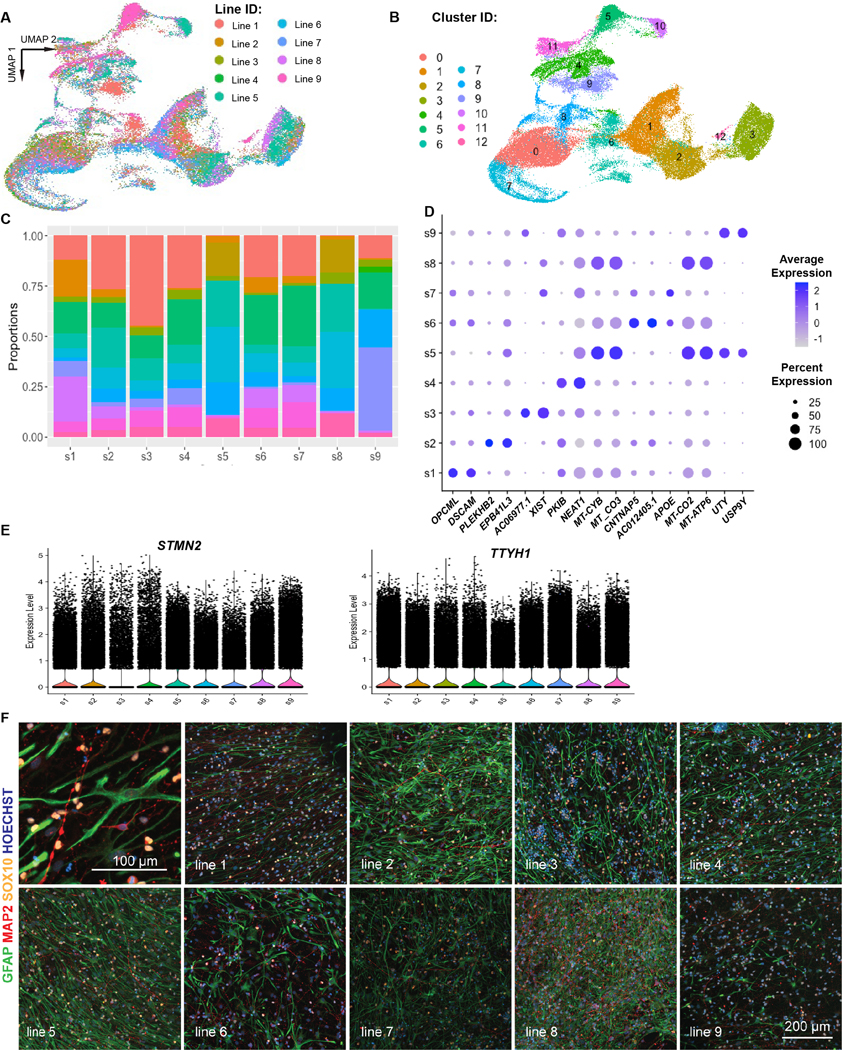
Extended Data Fig. 2. Survey of differentiation cell type heterogeneity across 9 iPSC lines.

a) UMAP of 128,839 nuclei from 9 different iPSC lines (see Methods for line information). b) Clustering of nuclei from a based on gene expression. c) Cell type proportion for each cluster identified in b) for each of the 9 iPSC lines tested suggest broad representation of each cell type in each iPSC line. d) Dot plot for the top 2 genes enriched in astrocytes from 9 different iPSC lines; differential expression analysis performed using the Wilcoxon ranked-sum test via Seurat. e) Normalized expression of STMN2 and TTYH1 shows similar expression of both genes across all 9 cell lines. f) One well of differentiated cells from each of the 9 lines were immunostained in parallel for cell type marker genes: GFAP (astrocytes; green), MAP2 (neurons; red), and SOX10 (oligodendrocytes; yellow) plus Hoescht 33342 nuclear stain (blue). Representative image from 2 independent wells.
