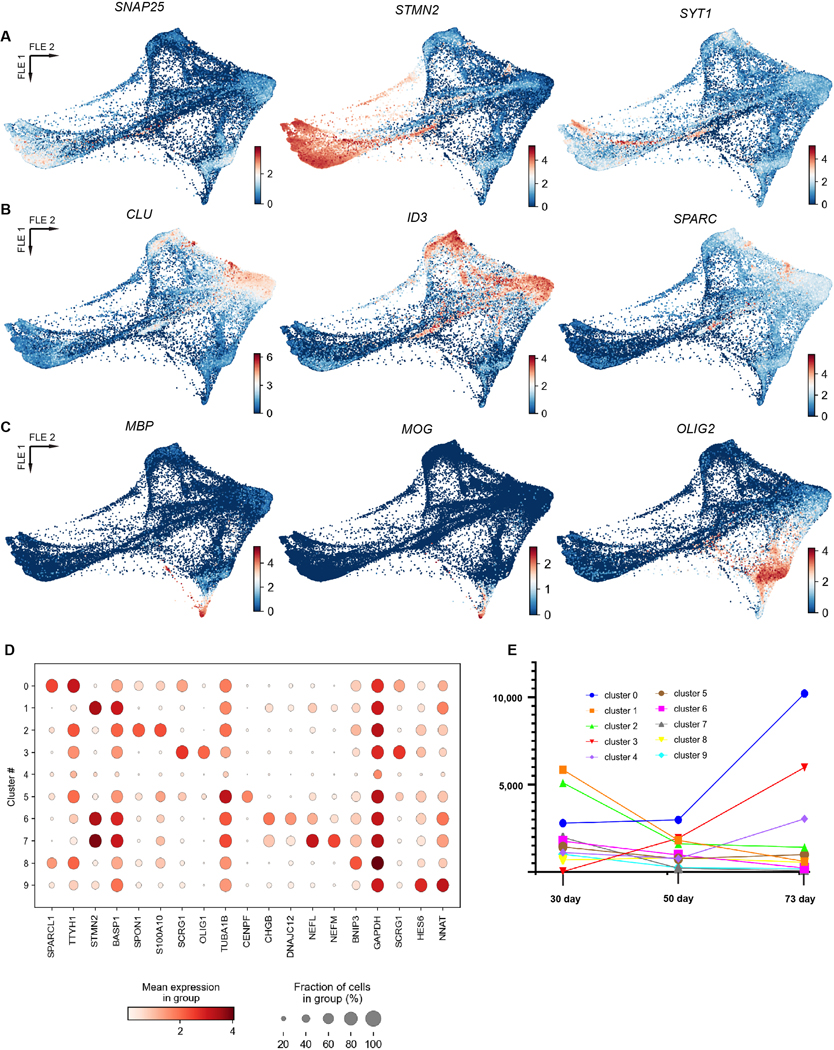
Extended Data Fig. 3. Cell type feature plots.
a) Feature maps for neuron cell-type marker genes (SNAP25, STMN2, SYT1). b) Feature maps for astrocyte cell-type marker genes (CLU, ID3, SPARC). c) Feature maps for oligodendrocyte cell-type marker genes (MBP, MOG, OLIG1). d) Dot plot of top enriched genes for each cluster as determined by Scanpy (clusters correspond to those numbered in Fig. 1d). e) Number of cells per cell-type at each time point.

