Fig. 6.

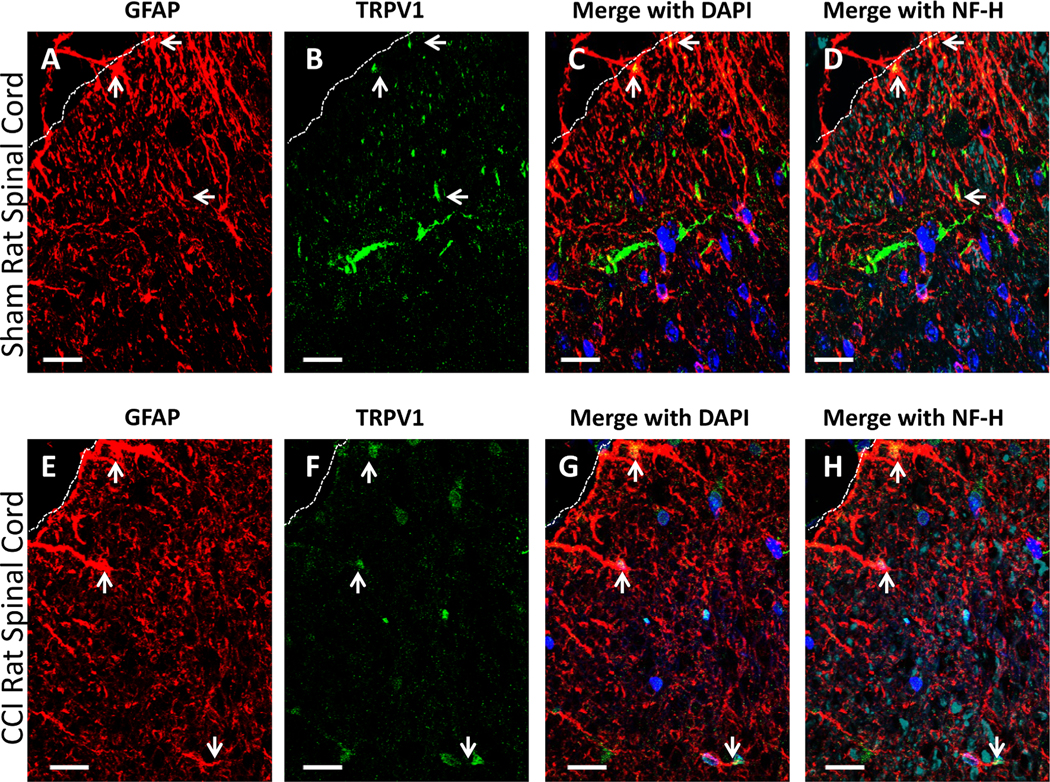
Qualitative confocal images of cellular immunofluorescent staining showing the spatial distribution of TRPV1 relative to astrocytes in spinal cord taken from sham and CCI-treated rats. (A-D) Spinal cord tissue from sham-treated rats. (E-H) Spinal cord tissue from CCI-treated rats. (A-D, E-H) Immunostaining of TRPV1 (green) in meninges and superficial laminae of the spinal cord and glial fibrillary acidic protein (GFAP) (red); co-labeled TRPV1 and GFAP appears yellow. 40,6-Diamidino-2-phenylindole (DAPI) nuclear labeling is blue, and neurofilament-H (NF-H) is cyan. White dashed lines indicate the border between spinal cord and intrathecal space. Arrows indicate GFAP and TRPV1, and co-expression in the superficial laminae. In all images the scale bar is equal to 20 um.
