Fig. 7.

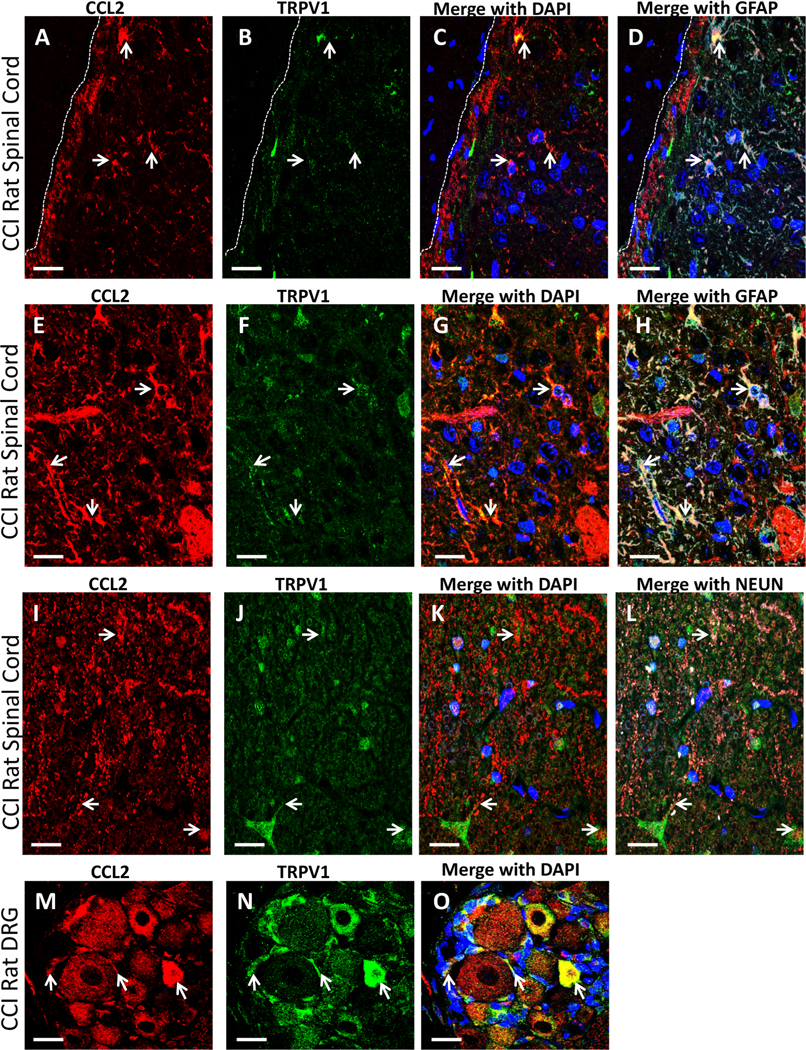
Qualitative confocal images of cellular IF staining of TRPV1, CCL2, and GFAP in rat lumbar dorsal horn spinal cord and DRG. (A-L) Spinal cord tissue from neuropathic rats. (A-D) Immunostaining of CCL2 (red), TRPV1 (green) in superficial laminae of the spinal cord dorsal horn, with co-labeling of IR (yellow), often on GFAP positive astrocytes (cyan). White arrows indicate regions of overlap with CCL2, TRPV1 and GFAP. DAPI nuclear labeling is also shown (blue). White dashed lines indicate the border between spinal cord and intrathecal space. (E-H) Deeper laminae of the dorsal horn of the spinal cord revealing IR of CCL2 (red) and TRPV1 (green) in with co-labeled (yellow) regions on GFAP positive astrocytes (cyan), as indicated with arrows. DAPI nuclear labeling is also shown (blue). (I-L) Deeper laminae of the dorsal horn of the spinal cord revealing IR of CCL2 (red) and TRPV1 (green) with neurons stained with Neun (cyan). DAPI nuclear labeling is shown (blue). Arrows indicate neurons that express both proteins. (M− O) DRG IR of CCL2 (red), and TRPV1 (green) in neuropathic rats revealing co-labeled staining (yellow) on neuronal cell bodies (white arrows) and small non-neuronal (possibly satellite cells; white arrows). DAPI nuclear labeling is shown (blue). In all images the scale bar is equal to 20 um.
