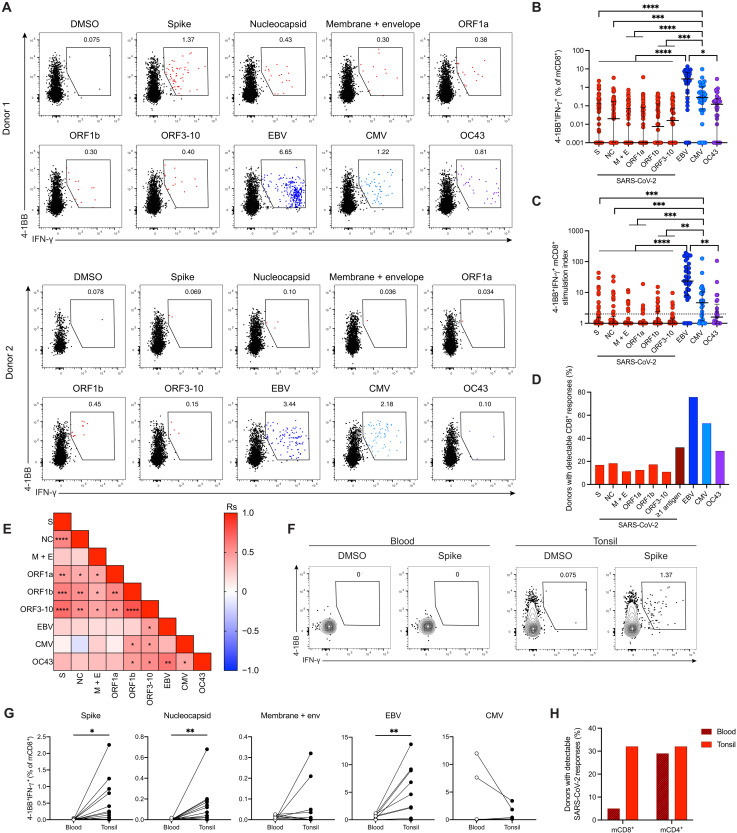
Fig. 1. Identification of tonsillar mCD8+ T cells specific for SARS-CoV-2 in unexposed individuals.
Tonsil cells from children (n = 40) and adults (n = 41) were stimulated with overlapping peptide pools and analyzed for intracellular expression of 4-1BB/IFN-γ. (A) Representative plots showing the gating of 4-1BB+IFN-γ+ mCD8+ T cells from individuals with responses to several SARS-CoV-2 proteins (top) or one SARS-CoV-2 protein (bottom). (B) Net frequencies (background subtracted) of 4-1BB+IFN-γ+ mCD8+ T cells. (C) Stimulation indices for 4-1BB+IFN-γ+ mCD8+ T cells calculated as fold change relative to the negative control. The dotted line indicates a stimulation index of 2. (D) Frequency of tonsil samples with positive antigen-specific mCD8+ T cell responses (stimulation index ≥2). (E) Correlation matrix showing associations between stimulation indices for virus-specific mCD8+ T cells. (F) Representative gating of 4-1BB+IFN-γ+ mCD8+ T cells in matched blood and tonsil samples. (G) Frequencies of 4-1BB+IFN-γ+ mCD8+ T cells in matched blood and tonsil samples. (H) Frequency of blood or tonsil samples with positive mCD4+ or mCD8+ T cell responses to SARS-CoV-2. (B to E) S, spike; NC, nucleocapsid; and M + E, membrane + envelope. (B and C) Graphs show median ± interquartile range (IQR). Kruskal-Wallis test with Dunn’s posttest. (E) Spearman correlations. (G) Wilcoxon signed-rank test. *P < 0.05; **P < 0.01; ***P < 0.001; ****P < 0.0001.

