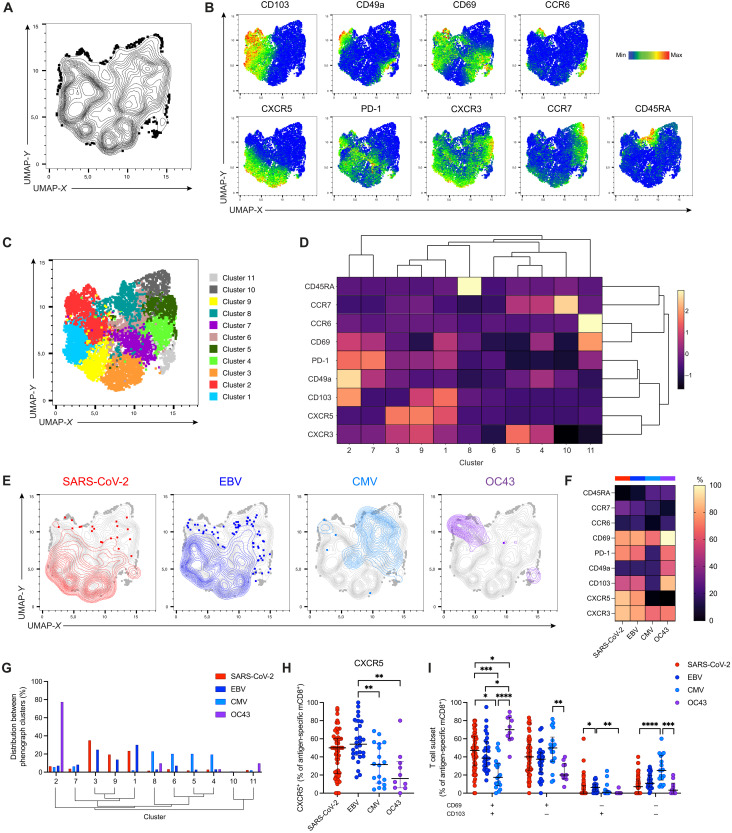
Fig. 3. Tonsillar SARS-CoV-2–specific mCD8+ T cells in unexposed individuals express CD103, CD69, and CXCR5.
(A) UMAP representation showing the clustering of concatenated total and virus-specific mCD8+ T cells from representative individuals (n = 4). (B) Expression of individual surface markers overlaid on the UMAP plot derived from (A). (C) UMAP representation derived from (A) with subpopulations (n = 11) identified using Phenograph. (D) Hierarchical clustering of expression intensity for the indicated markers in each subpopulation identified in (C). (E) Distribution of virus-specific mCD8+ T cells on the UMAP plot derived in (A). (F) Median percent expression of the indicated markers among virus-specific mCD8+ T cells. (G) Distribution of virus-specific mCD8+ T cells among clusters derived using Phenograph. Clusters are hierarchical as indicated in (D). (H) Frequency of CXCR5+ virus-specific mCD8+ T cells. (I) Comparison of virus-specific mCD8+ subsets based on the expression of CD69/CD103. (H and I) Graphs show median ± IQR. Kruskal-Wallis test with Dunn’s posttest. *P < 0.05; **P < 0.01; ***P < 0.001; ****P < 0.0001.

