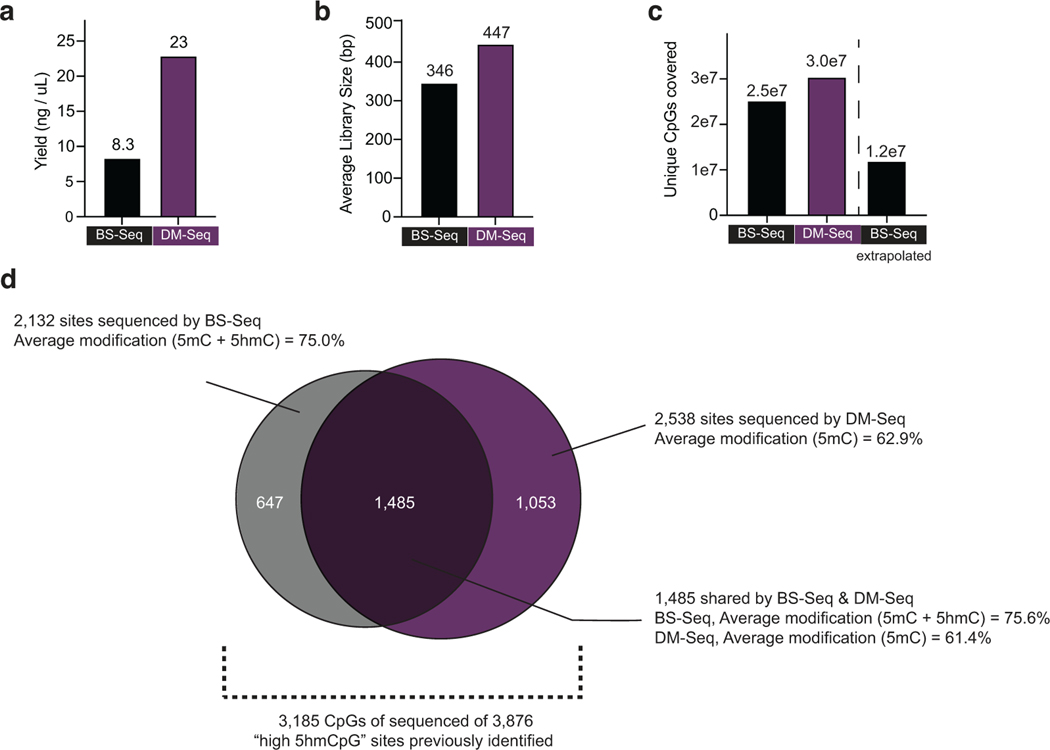
Extended Date Figure 10. Mammalian genome DM-Seq metrics.
DM-seq and BS-seq data from gDNA derived from a patient glioblastoma. a) Final library yield. b) Average size of library fragments (adapters included) determined using a Bioanalyzer. c) Unique CpGs covered by BS-Seq and DM-Seq. The extrapolated BS-Seq bar takes into account if the sequencer was loaded with the same volume of each library rather than by normalizing the amount of DNA loaded. d) High 5hmCpG sites, previously identified by oxBS-Seq of 30 tumors. The Venn diagram shows the portion of these CpG sites that were covered by BS-seq or DM-Seq with this glioblastoma sample. The metrics for the sites sequenced by either BS-Seq or DM-Seq alone are similar to those at the sites that were sequenced by both methods. The analysis in Fig. 4e focuses on the 1,485 shared CpG sites sequenced by both methods.

