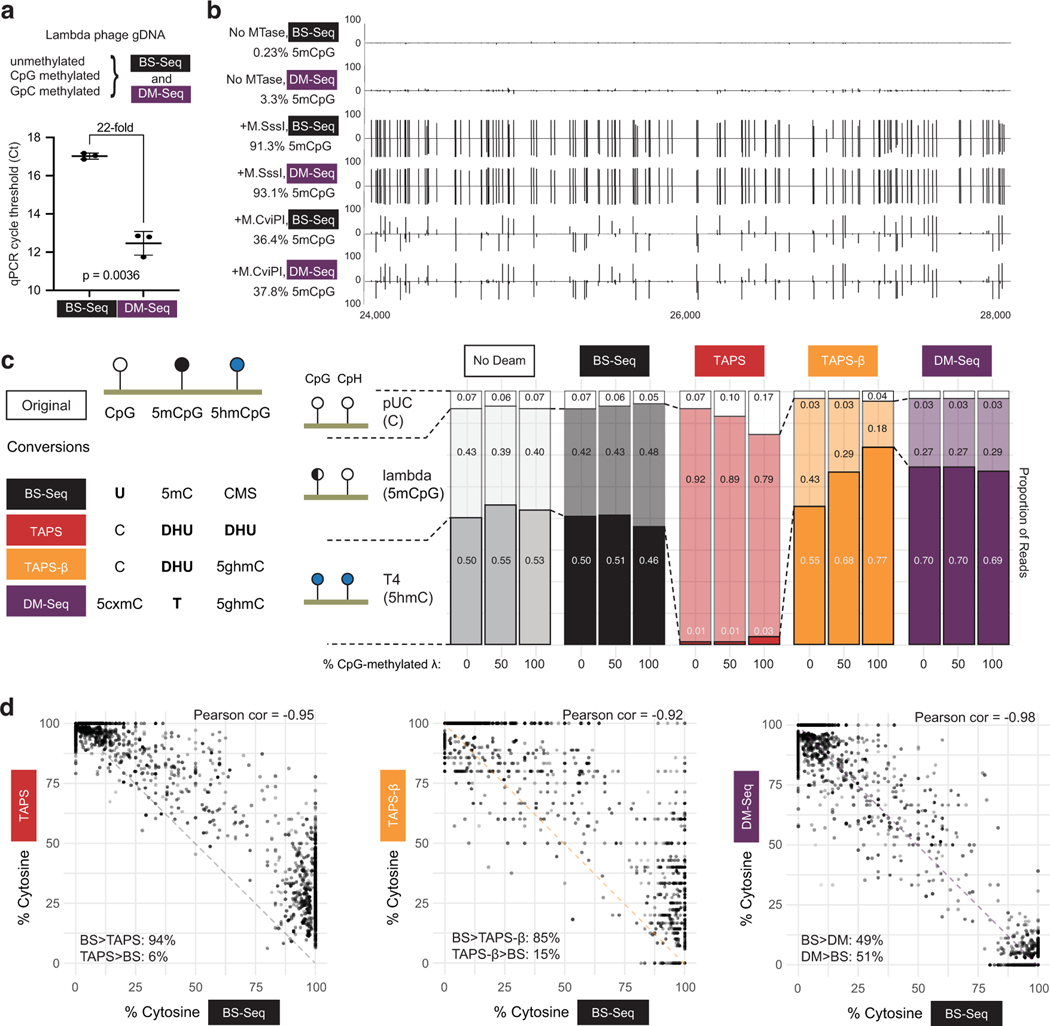
Figure 3. DM-Seq accurately detects 5mCpGs at single-base resolution and is more accurate than TAPS.
a) Difference in Ct between DM-Seq and BS-Seq determined by qPCR. p-value represents paired two-tailed t-test (n = 3 MTase conditions). Data are presented as mean values +/− SD. b) Shown is the genome browser view for coordinates 24,000–28,000 in the lambda phage genome for all CpGs. Lambda gDNA was modified with SAM and no MTase, M.SssI (CpG), or M.CviPI (GpC). Numbers on left represent total efficiency across the entire 48.5 kB genome. c) Comparison of multiple deamination-dependent sequencing workflows. At left is a schematic showing the state of specific DNA modifications after conversion and prior to library generation (cytosine methylene sulfonate, CMS; dihydrouracil, DHU; glucosylated 5hmC, 5ghmC). A mixture of 3 sheared DNA samples: unmodified pUC19 DNA, variably methylated lambda phage (0%, ~50%, or 100% CpG methylated), and T4-hmC phage (with all C bases replaced by 5hmC) was subjected to either no deamination, BS-Seq, DM-Seq, TAPS, or TAPS-β workflows. Plotted is the distribution of reads mapping to each genome under each condition, with the read fraction listed. d) Correlation of BS-Seq to DM-Seq, TAPS, TAPS-β on a M.CviPI GpC-methylated modified substrate. The dashed line shows the readout if BS-Seq signal inversely correlates with DM-Seq, TAPS, or TAPS- β as anticipated, with skew between methods suggested by asymmetrical distribution around this line. In the bottom corner of each plot, for sites where the two methods are not in agreement, the percent of sites where one method detects a higher level of modification than the other method are given.

