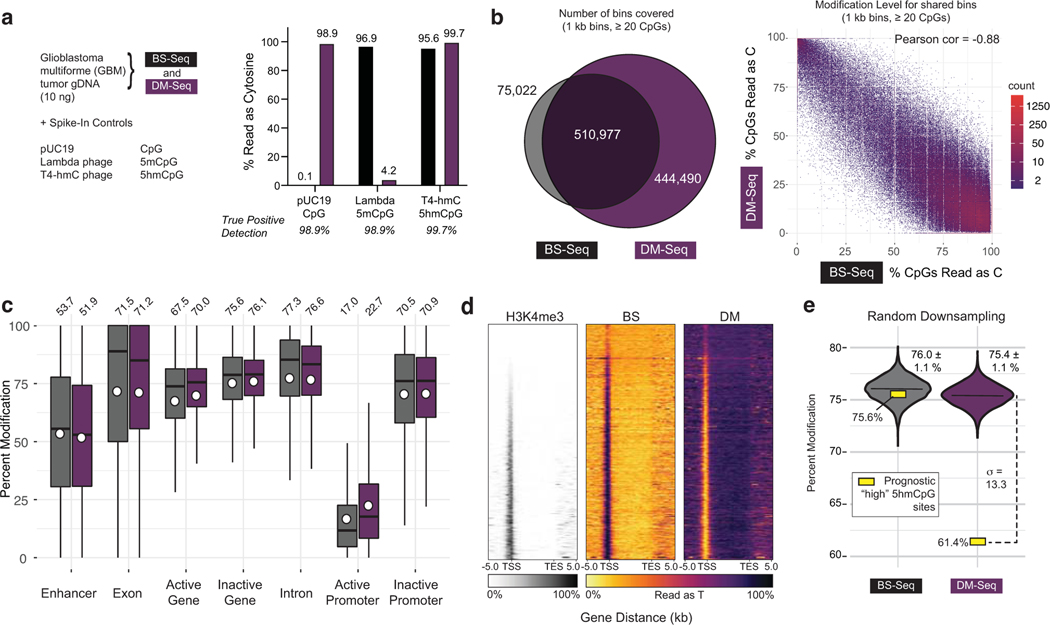
Figure 4. DM-Seq directly detects 5mCpGs in human glioblastoma.
a) Experimental design with spike-in controls showing accuracy of C, 5mC, and 5hmC detection. b) Binned CpG analysis using non-overlapping 1 kB bins with at least 20 CpGs covered. Left: Venn diagram showing bins covered by BS-Seq and DM-Seq. Right: Correlation between DM-Seq and BS-Seq in the 510,977 shared bins. c) Percent cytosine modification at various genomic features. The box shows the lower quartile, median, and upper quartile. Minimum and maximum values are shown by the whiskers. Circles are the mean values displayed above each boxplot. d) Heatmap representation of all annotated genes for H3K4me3 ChIP-Seq, BS-Seq, and DM-Seq. Genes are ranked by their average H3K4me3 signal. e) Observed DM-Seq and BS-seq signal at 3,876 previously defined “high 5hmCpG sites” (yellow square, DM-Seq: 61.4%, BS-Seq: 75.6%). The violin plot shows data from the shared BS and DM-Seq CpGs randomly downsampled 10,000 times to the same coverage as BS and DM-Seq at these sites. Data represents mean ± 1 standard deviation (BS-Seq = 76.0 ± 1.1%; DM-Seq = 75.4 ± 1.1%). The dotted line shows the number of standard deviations (13.3) between the downsampled (violin) and observed (yellow box) data at these prognostically significant CpGs. Extended data from these downsamplings are shown in Supplementary Table 4 and Extended Data Fig. 10.

