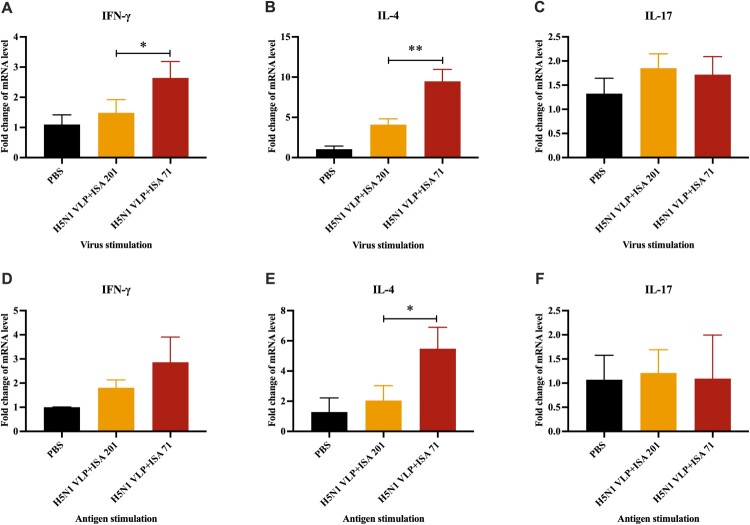
Figure 3.
Cytokine expression levels in PBMCs of SPF chickens (n = 3). The mRNA expression levels of IFN-γ, IL-4, and IL-17 after virus stimulation (A, B, C) or antigen stimulation (D, E, F) were determined using qRT-PCR. The cytokine levels among groups were compared using one-way ANOVA followed by Tukey’s multiple comparison test. Data represented mean ± SD. Statistical significance of differences is illustrated as follows: *p < 0.05, **p < 0.01.

