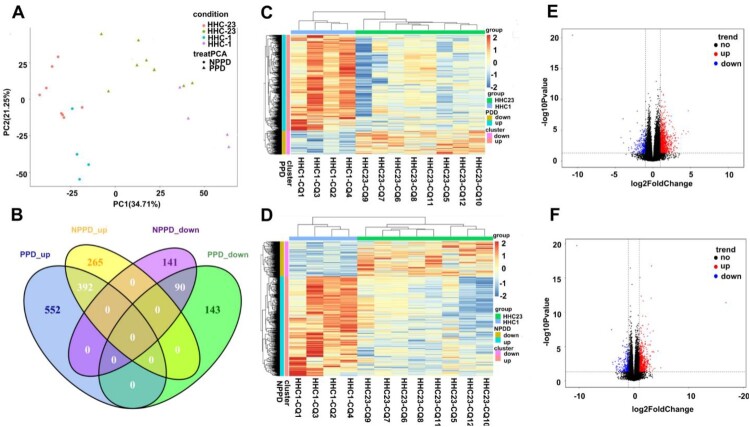
Figure 2.
Transcriptional patterns of peripheral blood mononuclear cells (PBMC) defining PPD-stimulated and un-stimulated of HHC-1 and HHC-23 group. RNA-seq were performed using 4 and 8 (4 from HHC-2 and 4 from HHC-3) PBMC samples from HHC-1 and HHC-23 group, respectively. A. Principal component analysis diagram. B. Venn diagrams showing overlaps of TB-specific genes changes between HHC-1 and HHC-23 group. Unsupervised hierarchical clustering of transcribed genes and differentially expressed over 1.5-fold of PPD-stimulated (C) and unstimulated samples (D). Volcano plot shows the upregulated and downregulated transcribed genes between HHC-1 and HHC-23 group of PPD-stimulated (E) and unstimulated samples (F).

