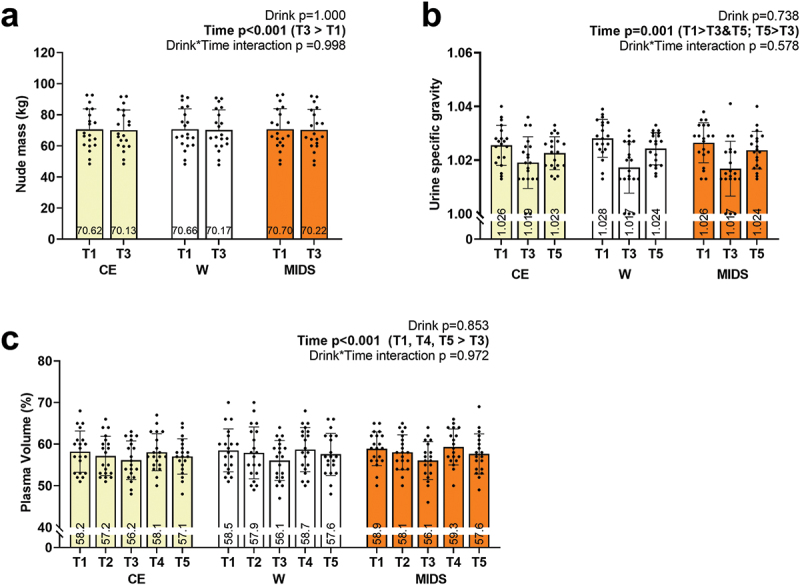
Figure 6.

Hydration markers. as seen above, no significant drink*time interactions existed for nude mass (panel a), urine specific gravity (panel b), or plasma volume changes (panel c). However, significant main effects of time existed for all markers whereby USG (for instance) was improved following exercise (which was likely due to the consumption of the drink prior to exercise). Nude mass also decreased post-exercise, regardless of drink), and this was likely due to sweat loss.
