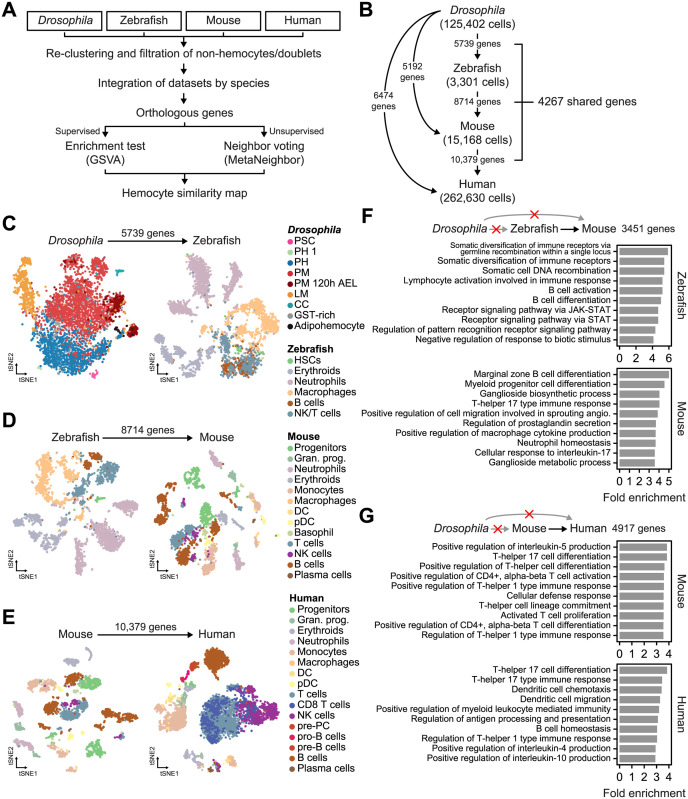
Fig 3. Identification of cell type clusters using orthologous genes.
(A) The workflow of the analysis comparing immune cell types between species. (B) A summary of the expressed orthologous genes between each species used in this study. (C) The t-SNE plots of Drosophila hemocytes and zebrafish immune cells using 5739 orthologous genes. The Drosophila data were downsampled to one-tenth (4389 cells). Data from all 3301 zebrafish cells were used. (D) The t-SNE plots of zebrafish and mouse immune cells using 8714 orthologous genes. The mouse data were randomly downsampled to one-fifth (3034 cells). (E) The t-SNE plots of mouse and human immune cells using 10,379 orthologous genes. The human data were randomly downsampled to one-fiftieth (5253 cells). (F and G) Bar plots showing the fold enrichment of biological processes as identified by gene ontology. Only genes conserved between zebrafish and mice (F) or mice and humans (G) were tested.

