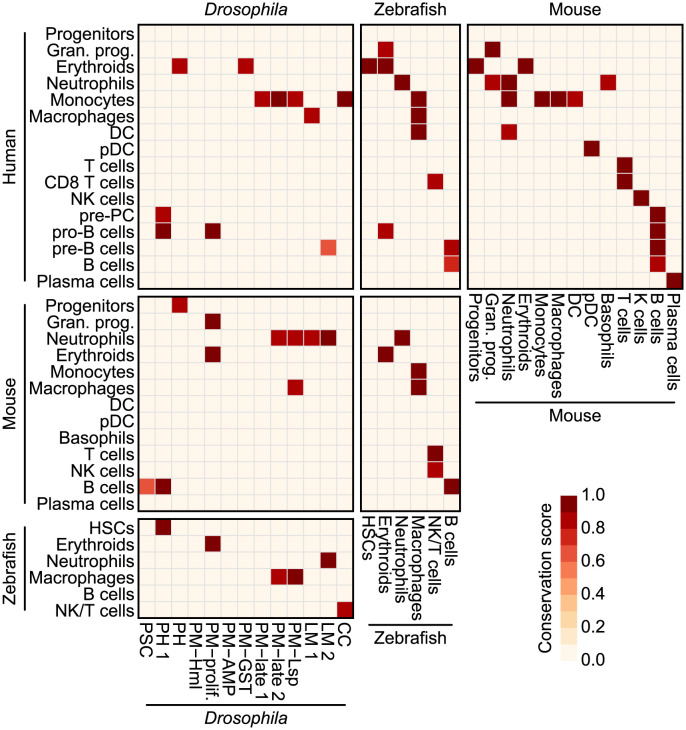
Fig 6. Conservation map of immune cells across species.
A conservation score heatmap predicted by integrating MetaNeighbor predictions and GSVA scores. Conservation scores were calculated by averaging MetaNeighbor AUROC and scaled GSVA scores for each cell type pair. Only cell type pairs assigned with reciprocal best hits by MetaNeighbor or conservation scores above 0.8 were included.

