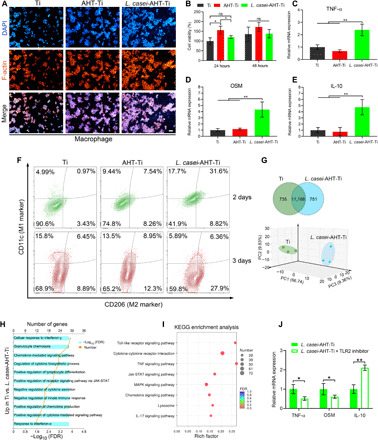
Fig. 2. Activation of macrophages by L. casei-AHT-Ti.

(A) Macrophages in the presence of Ti, AHT-Ti, and L. casei-AHT-Ti were stained by 4′,6-diamidino-2-phenylindole (DAPI; nucleus) and FITC-conjugated phalloidin (F-actin). Scale bar, 50 μm. (B) Cell viability of macrophages. Gene expression of (C) TNF-α, (D) OSM, and (E) IL-10. (F) Flow cytometry results of CD11c (M1 marker) and CD206 (M2 marker) expression (gated on CD11b+) after 2 and 3 days of treatments. (G) Venn diagram of differentially expressed genes treated by Ti and L. casei-AHT-Ti (top) and PCA plot shows the obvious separation gene expression of macrophages (bottom). (H) Up-regulated GO 514 enrichment analysis in L. casei-AHT-Ti compared with Ti. FDR, false discovery rate; JAK, Janus kinase; STAT, signal transducer and activator of transcription. (I) KEGG pathway analysis of the identified different gene expression. MAPK, mitogen-activated protein kinase. (J) Gene expression of TNF-α, OSM, and IL-10 in the presence of TLR2 inhibitor. n = 3 independent experiments per group, *P < 0.05 and **P < 0.01.
