
Fig. 4. Kidney organoids bearing the homozygous NOS1AP patient variant c.428G>A exhibit aberrantly formed glomeruli.
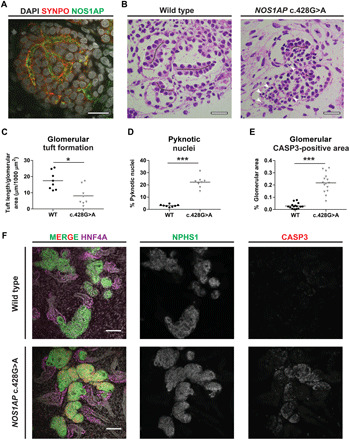
(A) IF imaging demonstrated NOS1AP localization to podocytes in organoid glomeruli adjacent to the podocyte marker SYNPO. Scale bar, 20 μm. (B) In WT and NOS1AP c.428G>A mutant organoids (PAS staining), glomerular tufts (within white dashed lines) were defined as linear podocyte monolayers organized bilaterally about established extracellular matrix (black lines) and were reduced in NOS1AP mutant organoids. NOS1AP mutant glomeruli also exhibited increased pyknotic nuclei (arrowheads), indicative of cell death. Scale bars, 20 μm. Also see fig. S8H for additional images of PAS staining. Scale bars, 20 μm. (C) Cumulative glomerular tuft length measurement is plotted from two to three independent fields (dots) from three independent organoid cultures. NOS1AP mutant organoids demonstrate significantly lower cumulative tuft length than WT organoids (Mann-Whitney U test, *P < 0.05). (D) Percentage of pyknotic nuclei is plotted from independent fields and organoids as in (B). NOS1AP mutant organoids exhibit significantly increased pyknotic nuclei relative to WT organoids (Mann-Whitney U test, ***P < 0.001). (E) Quantification of active caspase-3 (CASP3) staining in glomerular regions is shown from three paired differentiation experiments to substantiate increased cell death that was indicated by pyknotic nuclei in (B) and (D). NOS1AP mutant organoids demonstrate elevated apoptosis (Mann-Whitney U test, ***P < 0.001). (F) Whole mount IF of organoids for apoptotic marker cleaved CASP3 is shown. CASP3 staining is increased in glomeruli (NPHS1) of NOS1AP mutant organoid glomeruli, relative to WT organoids. CASP3 signal in tubular segments (HNF4A) is not increased. Scale bars, 100 μm. Also see fig. S8G for CASP3 staining in organoids derived from the second independent iPSC cell line PCS201010.