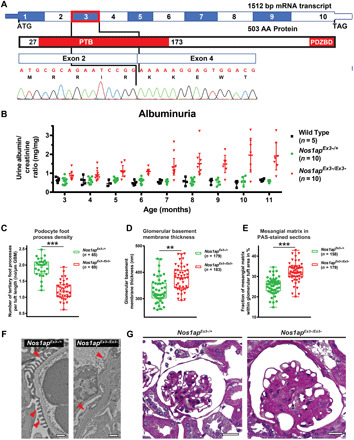
Fig. 5. Nos1apEx3−/Ex3− mice develop glomerular proteinuria, foot process effacement, and mesangial matrix expansion.

(A) Coding exon (top) and protein domain (bottom) structures of murine Nos1ap and Sanger sequencing trace for Nos1apEx3−/Ex3− cDNA are shown. Exon 3 deletion (red rectangle) causes an in-frame deletion within the PTB domain. (B) Urinary albumin/creatinine ratios were measured. Nos1apEx3−/Ex3− mice develop significant albuminuria. (C) Podocyte foot process density was quantified in transmission electron microscopy (TEM) images for Nos1apEx3−/+ and Nos1apEx3−/Ex3− mice [five animals per genotype, 11 months old (three) and 16 months old (two); 65 and 69 capillary loops per genotype, respectively]. Foot process effacement is observed in homozygous Nos1apEx3−/Ex3− mice. (Each dot represents one capillary loop, and bars represent minimum to maximum; Kruskal-Wallis test, ***P < 0.001). (D) Increased glomerular basement membrane (GBM) thickness was observed in TEM images of homozygous Nos1apEx3−/Ex3− mice. (Bars represent minimum to maximum; Kruskal-Wallis test, **P < 0.01). (E) Mesangial matrix area per glomerulus in PAS staining was increased in homozygous Nos1apEx3−/Ex3− mice. [Each dot represents one glomerulus, and bars represent minimum to maximum; five animals per genotype, 11 months old (three) and 16 months old (two); 158 and 179 images per genotype, respectively; Kruskal-Wallis test, ***P < 0.001]. (F) Representative glomerular TEM images for Nos1apEx3−/+ and Nos1apEx3−/Ex3− mice demonstrate podocyte foot process effacement and thickened basement membranes. Scale bars, 1 μm. (G) Representative PAS images show mesangial matrix expansion, partially collapsed capillary loops, and thickened basement membranes in Nos1apEx3−/Ex3− mice. Scale bars, 200 μm. Also see fig. S10.
