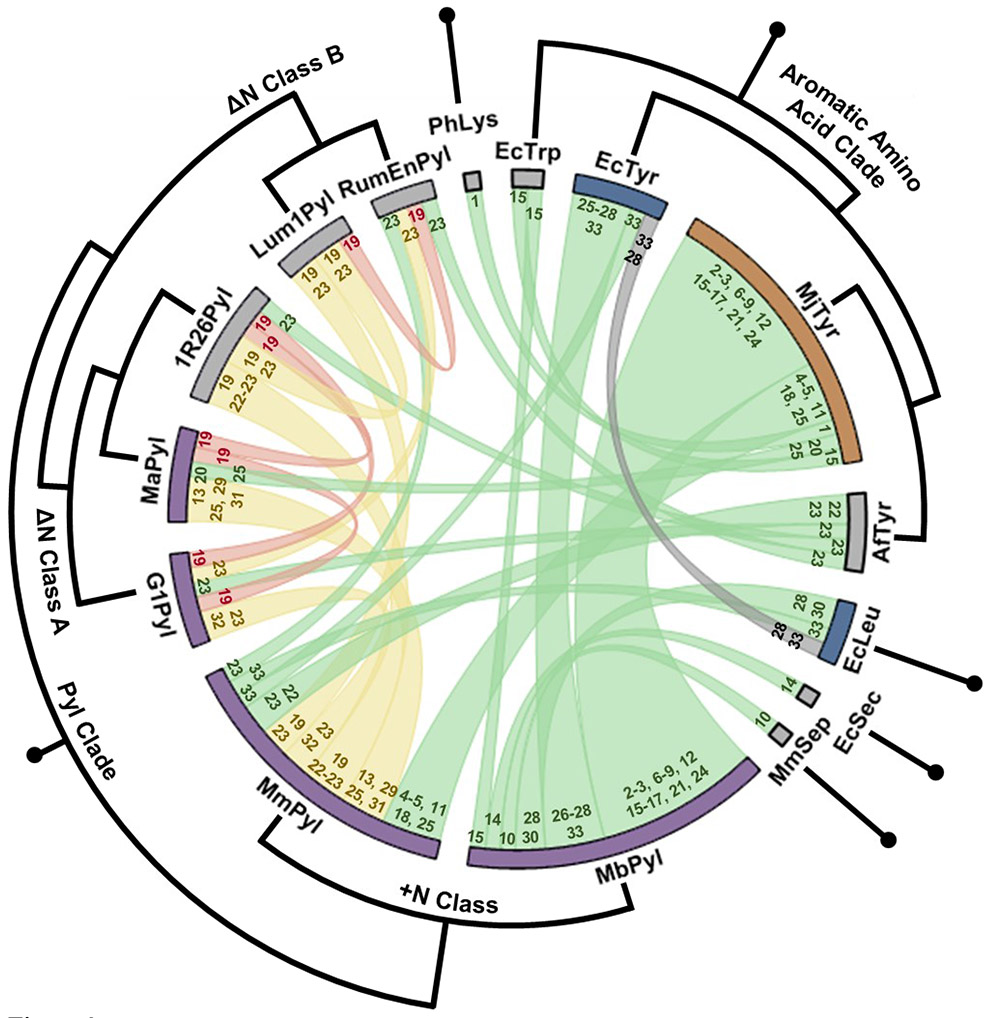
Figure 3.
Orthogonality relationships between all aaRS/tRNA subsystem pairings from the publications in Table 1. The thickness of the chord between a pair of aaRS nodes reflects the frequency that that combination has been used. The colors indicate pairs that are naturally orthogonal (green), are not orthogonal (red), or that have been engineered to be orthogonal (yellow). The gray chord indicates a discrepancy between observations in Table 1 entries 27 and 32. The numbers at the ends of the chords indicates the relevant entry numbers in Table 1. The color of the node (the bar at the edge of the circle) indicates orthogonality of that subsystem with only prokaryotic (orange), with only eukaryotic (blue) or with both (purple) host decoding systems, while gray indicates that orthogonality has only been assessed in one host. Surrounding the chord plot is a circular cladogram showing the level of similarity of aaRSs within various clades (alignments performed using Clustal Omega185).

