

Abstract
Alzheimer’s disease (AD) is the most common type of dementia, characterized by early memory impairments and gradual worsening of daily functions. AD-related pathology, such as amyloid-beta (Aβ) plaques, begins to accumulate many years before the onset of clinical symptoms. Predicting risk for AD via related pathology is critical as the preclinical stage could serve as a therapeutic time window, allowing for early management of the disease and reducing health and economic costs. Current methods for detecting AD pathology, however, are often expensive and invasive, limiting wide and easy access to a clinical setting. A non-invasive, cost-efficient platform, such as computerized cognitive tests, could be potentially useful to identify at-risk individuals as early as possible. In this study, we examined the diagnostic value of an episodic memory task, the mnemonic discrimination task (MDT), for predicting risk of cognitive impairment or Aβ burden. We constructed a random forest classification algorithm, utilizing MDT performance metrics and various neuropsychological test scores as input features, and assessed model performance using area under the curve (AUC). Models based on MDT performance metrics achieved classification results with an AUC of 0.83 for cognitive status and an AUC of 0.64 for Aβ status. Our findings suggest that mnemonic discrimination function may be a useful predictor of progression to prodromal AD or increased risk of Aβ load, which could be a cost-efficient, noninvasive cognitive testing solution for potentially wide-scale assessment of AD pathological and cognitive risk.
Keywords: Mnemonic discrimination tasks, Alzheimer’s disease, Mild cognitive impairment, Amyloid-beta pathology, Random forest classification, Pattern separation
1. Introduction
Alzheimer’s disease (AD) is an age-related neurodegenerative disorder associated with profound cognitive and functional impairment. As the life span of aging population increases, the number of AD cases is projected to reach up to 13.8 million by 2050 in the United States (Hebert et al., 2013) and 152 million worldwide (Zeisel et al., 2020). Currently, there are only a few preventive medications approved (e.g., lecanemab) (van Dyck et al., 2023), imposing a substantial burden on affected individuals, communities, and healthcare systems. AD starts with accumulation of neuropathology many years before symptoms appear (Jack et al., 2013), and about a third of cognitively normal older individuals are known to have high amyloid-beta (Aβ) pathology prior to showing clinical symptoms (Aizenstein et al., 2008; Villemagne et al., 2008). Up to 70% of older individuals who are diagnosed with mild cognitive impairment (MCI), a prodromal stage between normal aging and AD with increased risk for AD dementia, have been shown to have concomitant AD-related pathology (Jansen et al., 2015; Petersen et al., 2001). Because not all the AD-related neuropathology is reversible, early identification and treatment of individuals with high risk for developing MCI or AD is of paramount importance. Timely identification of at-risk individuals will allow early management and planning of long-term care (Leifer, 2003). Prognostics can also help design clinical trials (i.e., screening for target population), facilitate precise intervention plans, and further provide a critical time window for attenuating AD-related symptoms.
Post-mortem neurohistology has been the gold standard for detecting AD pathology including Aβ plaques and neurofibrillary tangles (Hyman and Tanzi, 1992), demonstrating that Aβ deposition starts in the neocortex and gradually progresses toward the allocortex, midbrain, and eventually the cerebellum (Thal et al., 2002). Hyperphosphorylated tau accumulation begins at the locus coeruleus (Ehrenberg et al., 2017; Jacobs et al., 2021), followed by a typical cortical spatiotemporal distribution pattern from the transentorhinal region to the association and sensory cortices (Arnold et al., 1991; Braak and Braak, 1991). A growing volume of work has demonstrated the diagnostic utility of in vivo pathological biomarkers to predict AD risk prior to clinical onset using positron emission tomography (PET) imaging (Jack and Holtzman, 2013; Sperling et al., 2011). However, the relationship between the extent of pathology, particularly Aβ, and the severity of cognitive impairment remains debated (Arriagada et al., 1992; Hyman et al., 1993; Ingelsson et al., 2004; Perez-Nievas et al., 2013). For example, a recent meta-analysis by Ackley et al. (2021) analyzing results from 14 randomized controlled trials of Aβ-targeting drugs suggest that these therapies have not yielded meaningful improvements on mini-mental state examination (MMSE) scores. A potentially viable strategy for future trials could be to identify asymptomatic individuals with elevated Aβ burden.
Several in vivo tools for measuring AD-related pathology and neurodegeneration, including magnetic resonance imaging (MRI), PET, and fluid biomarkers (e.g., cerebrospinal fluid [CSF], blood, saliva), have opened new research avenues for early detection of pathology and characterizing the AD trajectory. Elevated Aβ and tau measured by either PET or CSF (Quigley et al., 2011; Stephan et al., 2012), brain atrophy (Pini et al., 2016), and functional network dysfunction (Ibrahim et al., 2021; Puttaert et al., 2020) are associated with cognitive status along the AD continuum. While these methods can be useful for early diagnosis and monitoring disease progression, they may be somewhat invasive (e.g., injection of radioactive tracers for PET, or lumbar puncture for CSF collection), expensive, and require a trained expert to analyze and interpret results. Computer-based cognitive testing may provide a low-cost, accessible, and non-invasive solution to early detection of cognitive change and accumulation of key AD pathological markers.
While computerized cognitive testing may be a viable solution to early disease detection, as they can be easily administered during routine clinical assessments in older populations, it is currently unclear what kind of cognitive test may be sensitive and specific enough to detect the earliest pathophysiology or symptoms in AD. Deficits in episodic memory is one of the key hallmarks of AD, and cognitively normal older adults were shown to exhibit deficits in mnemonic discrimination—the ability to differentiate between highly similar objects or events—while more traditional measures of recognition memory remain intact (Berron et al., 2018; Stark et al., 2013; Yassa et al., 2011). This suggests that early impairments in this domain may be clinically meaningful. Early evidence of the neural correlates supporting this function comes from studies of amnesic patients by the late Andrew Mayes and colleagues (Holdstock et al., 2002; Mayes et al., 2002; Migo et al., 2009) who demonstrated that the hippocampus and adjacent cortices play a role in recollection as well as recognition of items that are highly similar (i.e., discrimination) – a major inspiration for the current work. Following Mayes’ pioneering work, a host of studies also have demonstrated impaired recognition and mnemonic discrimination in MCI patients (Belliart-Guerin and Planche, 2023; Bennett et al., 2019; Stark et al., 2013; Yassa et al., 2010).
Evidence from rodent and neuroimaging studies also supported the notion that subfields of the hippocampus (dentate gyrus and CA3) orthogonalize similar patterns into distinct neural representation (i.e., pattern separation), putatively supporting the mnemonic discrimination function (Bakker et al., 2008; Leutgeb et al., 2004). Multiple variants of mnemonic discrimination tasks have been developed across different cognitive domains (e.g., object, spatial, temporal, emotion) (Leal and Yassa, 2014; Reagh et al., 2014, 2018; Stark and Stark, 2017), all of which are considered to be linked to hippocampal integrity (Stark et al., 2019). The direct relationship between AD pathology and mnemonic discrimination performance, however, has not yet been fully assessed.
In this study, we aimed to address these unknowns by taking a machine learning approach to examine whether the mnemonic discrimination tasks (MDT) can be utilized for prediction of cognitive status (normal versus MCI) as well as risks for Aβ burden in a sample of extensively phenotyped older adults without an MCI or dementia diagnosis. Interest in developing machine learning-based approaches for AD prognosis or diagnosis is growing, and numerous studies have demonstrated that artificial intelligence approaches facilitate classification of cognitive status across the AD continuum based on multidimensional datasets (e.g., neuroimaging, genetic biomarker, neuropsychological test scores) as input features (Falahati et al., 2014). While prediction of conversion from MCI to AD or from normal to AD have been extensively studied, prediction of transition from normal to MCI has been less explored, and few studies have examined whether cognitive or behavioral assessments improve model performance. Here, we demonstrate the potential of MDTs as an inexpensive, non-invasive platform for early prognosis of prodromal AD or elevated cerebral Aβ burden.
2. Materials and methods
2.1. Participants
Data from two studies were used: the Biomarker Exploration in Aging, Cognition, and Neurodegeneration (BEACoN) study and the Alzheimer’s Disease Research Center (ADRC) Project 1 at the University of California, Irvine. The BEACoN study is an ongoing study that aims to develop neuroimaging biomarkers for cognitive decline in preclinical AD. Up to 150 cognitively normal older adults (60 years and older) from community are being enrolled, completing a battery of neuropsychological assessments, mnemonic discrimination tasks, and [18F]-Florbetapir (FBP) PET to measure Aβ. Normal cognition was defined as a Clinical Dementia Rating of 0, mini mental state examination (MMSE) score of 27 or higher, and neuropsychological test performance within 1.5 SD of age-adjusted norms.
Project 1 of the ADRC is a completed study originally aimed to recruit cognitively normal older adults (n = 30) as well as older adults with amnestic MCI (n = 15)(Albert et al., 2011) to understand the neural basis of preclinical AD through identification of non-invasive biomarkers. Participants were characterized by the Uniform Data Set (UDS) in accordance with the National Alzheimer’s Coordinating Center (NACC) criteria (Besser et al., 2018; Weintraub et al., 2018) and had a clinician diagnosis (normal or MCI) on cognitive status based on the NACC-UDS guidelines. For MCI, a panel consensus diagnosis was made when 1) there was concern about a change in cognition (by the subject, informant, or clinicians) compared to the subject’s previous level, 2) there was impairment in one or more cognitive domains (memory, executive function, language, attention, and visuospatial skills), and 3) functional independence was preserved for most daily abilities, requiring minimal assistance in living. Participants in the Project 1 also completed the mnemonic discrimination tasks as well as lumbar puncture for cerebrospinal fluid Aβ measurement (see below).
In order to maximize our sample size, we combined data from both studies, ensuring every participant had complete data available including demographic information, amyloid measures (PET or CSF), and performance scores on MDT, MMSE, and Rey auditory verbal learning test (RAVLT). We analyzed a total of 104 participants (mean age = 72.1 yrs, range 60–89 yrs, 65 females), 82 of whom were part of the BEACoN study and 9 of whom had a clinician diagnosis of MCI. All participants were free of major neurological and psychiatric disorders, spoke fluent English, had visual and auditory acuity adequate for neuropsychological and computerized testing, and were free of neuroimaging (MRI or PET) contraindications. Participants gave written informed consent in accordance with the Institutional Review Board of the University of California, Irvine, and were compensated for their participation. Table 1 summarizes the demographic and clinical characteristics of the participants involved in the study.
Table 1.
Demographics and clinical and neuropsychological characteristics of the study participants.
| Demographics Total (n = 104) | CN | MCI | Group differencea | Group differenceb | |
|---|---|---|---|---|---|
| Low Aβ | High Aβ | p value | p value | ||
| N | 67 | 28 | 9 | – | – |
| Age (yrs) | 71.1 (6.3) | 73.1 (7.3) | 76.5 (9.6) | 0.05 | 0.19 |
| Female (%) | 61.2 | 78.6 | 22.2 | – | – |
| Education (yrs) | 16.8 (2.3) | 16.1 (2.5) | 17.0 (2.3) | 0.62 | 0.17 |
| Race (%) | |||||
| White | 71.6 | 89.3 | 88.9 | – | – |
| Asian | 22.4 | 10.7 | 11.1 | – | – |
| Black | 1.5 | 0 | 0 | – | – |
| More than one | 1.5 | 0 | 0 | – | – |
| Other | 3.0 | 0 | 0 | – | – |
| MMSE | 28.4 (1.3) | 28.6 (1.5) | 27.4 (2.1) | 0.04 | 0.34 |
| MDTO LDI | 0.27 (0.15) | 0.31 (0.12) | 0.198 (.10) | 0.10 | 0.14 |
| MDTO Rec | 0.81 (0.15) | 0.81 (0.11) | 0.64 (0.18) | 0.001 | 0.95 |
| MDTO d’ | 3.58 (1.75) | 3.19 (1.45) | 2.08 (0.90) | 0.02 | 0.31 |
| MDTO d’High | 0.87 (0.93) | 0.92 (0.62) | 0.50 (0.24) | 0.18 | 0.79 |
| MDTO d’Low | 1.42 (0.94) | 1.44 (0.75) | 0.91 (0.35) | 0.09 | 0.91 |
| MDTS LDI | 0.25 (0.16) | 0.28 (0.12) | 0.09 (0.10) | 0.001 | 0.46 |
| MDTS Rec | 0.39 (0.21) | 0.43 (0.19) | 0.11 (0.13) | <0.001 | 0.42 |
| MDTS d’ | 1.26 (0.90) | 1.68 (1.50) | 0.31 (0.39) | 0.01 | 0.10 |
| MDTS d’High | 0.60 (0.71) | 0.69 (0.80) | 0.11 (0.31) | 0.04 | 0.59 |
| MDTS d’Low | 1.03 (0.80) | 1.27 (1.02) | 0.71 (0.99) | 0.22 | 0.22 |
| RAVLT - immediate | 10.8 (3.1) | 11.0 (3.4) | 6.7 (3.6) | <0.001 | 0.79 |
| RAVLT - delayed | 10.8 (3.3) | 10.7 (3.8) | 5.8 (4.8) | <0.001 | 0.85 |
| RI | 0.84 (0.17) | 0.85 (0.20) | 0.65 (0.24) | 0.004 | 0.72 |
| Learning | 1.74 (0.51) | 1.49 (0.61) | 1.44 (0.78) | 0.27 | 0.05 |
| Forgetting | 0.17 (0.19) | 0.17 (0.24) | 0.46 (0.39) | <0.001 | 0.99 |
| Comorbidities | |||||
| Diabetes | 4 | 0 | 1 | – | – |
| Heart disease | 2 | 0 | 0 | – | – |
Data are presented as mean (SD). Group differences were assessed by two-sample independent T tests. CN = cognitively normal, MCI = mild cognitive impairment, Aβ = amyloid, MMSE = mini-mental state exam, MDTO = object version of the mnemonic discrimination task, MDTS = spatial version of the mnemonic discrimination task, LDI = lure discrimination index, Rec = recognition, d’High = d’ for high similarity lures, d’Low = d’ for low similarity lures, RAVLT = Rey auditory verbal learning test, RI = retrospective interference.
CN vs. MCI,
Low Aβ vs. High Aβ
2.2. Aβ cerebrospinal fluid marker
Cerebrospinal fluid samples were collected from the participants in the ADRC cohort via lumbar puncture for analysis of variables related to Aβ load (e.g., Aβ1–40, Aβ1–42). Following standard clinical research methods in aseptic fashion by a board-certified neurologist, samples were collected in a 15 mL Falcon tube and were placed on ice until processed (within 2 h), aliquoted into 250 μL volumes and stored at −80 °C. The LUMIPULSE G 1200, a fully automated immunoassay instrument (Fujirebio, Malvern PA), was used to estimate the levels of Aβ1–42 and Aβ1–40 markers using a chemiluminescent enzyme immunoassay (CLEIA) by the UCSD Shirley-Marcos ADRC Biomarker Core. The primary measure used for current study was the ratio of Aβ1–42 and Aβ1–40, accounting for individual differences among Aβ isoforms. A cutoff value of 0.062 (Alcolea et al., 2019) was used to group the participants into two classes: low (>0.062) and high Aβ burden (<0.062).
2.3. Amyloid PET image acquisition and processing
Participants in the BEACoN study underwent FBP PET imaging conducted on a High Resolution Research Tomograph at the University of California, Irvine Neuroscience Imaging Center. Image acquisition followed the Alzheimer’s Disease Neuroimaging Initiative (ADNI) (Landau et al., 2013) protocol consisting of 4 × 5-min frames collected 50–70 min after ligand injection. Ten mCi (370MBq) of FBP was injected, followed by a saline flush. During the uptake participants rested comfortably in a dimly lit room with their eyes open.
Structural T1-weighted magnetization prepared rapid gradient echo (MPRAGE) scans were acquired on a 3-T Siemens Magnetom Prisma scanner at the Facility for Imaging and Brain Research, University of California, Irvine, using the following parameters: orientation = sagittal, TR = 2300ms, TE = 2.38ms, FA = 8, voxel resolution = 0.8 mm isotropic, FOV = 256 mm, SENSE acceleration factor = 3. Segmentations were then computed on these images using the Desikan/Killiany atlas in the Freesurfer (Version 6)(Desikan et al., 2006).
The PET data were reconstructed with attenuation correction, scatter correction, and 2 mm3 Gaussian smoothing. Images were realigned, co-registered to T1-MPRAGE scans, and normalized by a whole cerebellum reference region to create standard uptake values ratios (SUVR) images. Additional 6 mm3 Gaussian smoothing was performed to achieve an effective resolution of 8 mm3. The mean SUVR of previously validated cortical composite regions was used to classify the participants into two groups using a cutoff SUVR of 1.10: low (≤1.10) and high (>1.10) Aβ (Landau et al., 2012, 2013).
2.4. Concordance between FBP-PET and CSF Aβ measurement
A recent study by Adams et al. (2023) assessed concordance between CSF-based and PET-based Aβ measures with respect to diagnosis of cognition (normal and MCI). The authors showed high concordance between the two measures with high accuracy (0.93 ± 0.13), precision (0.93 ± 0.17), and an overall AUC of 0.92 (±0.16). In the current study, we combined data from both groups for all the analyses.
2.5. Rey auditory verbal learning test
The Rey auditory verbal learning test (RAVLT) is a standard neuropsychological verbal memory test that had been widely used as a proxy for episodic memory functions and impairments in aging and dementia (Savage and Gouvier, 1992). The test involves a free recall paradigm in which participants listen to a list of 15 nouns (list A) and are asked to recall aloud as many words as possible. Following 5 repetitions of word recall (A1 to A5), a new list (B) is introduced for “interference” with words presented in the list A. Participants then are asked to recall the words from list A (immediate recall, A6) and 20-mins later asked again to recall as many words as possible (delayed recall, A7). Performance scores were calculated based on the number of words recalled. Other performance metrics were calculated as following: learning rate (learning slope [LS] = [A5–A1]/4); susceptibility to interference (retrospective interference [RI] = A6/A5); forgetting rate ([A5–A7]/5). All the five variables were included as input features.
2.6. Mnemonic discrimination tasks
Participants completed the computerized Mnemonic Discrimination Task (MDT) in object (MDTO) and spatial (MDTS) domains, as described previously (Adams et al., 2022; Reagh et al., 2016; Reagh and Yassa, 2014)(Fig. 1). Programmed in Python (version 2.7) using PsychoPy (Peirce, 2007), the MDTs are based on a recognition memory test paradigm including a study (encoding) phase immediately followed by a test (a surprise recognition memory test) phase. During the study phase, participants saw a series of object stimuli (120 for MDTO and 160 for MDTS), one at a time (2 s each, ISI = 0.5 s), on a white background. For each trial, participants were asked to indicate whether an item was an “indoor” or “outdoor” object using a key press. In the MDTO, each object was presented at the center of the screen. In the MDTS, each object was presented in a random grid position within the screen. During the test phase, participants were shown another series of stimuli, one at a time (2 s each, ISI = 0.5 s). For the MDTO, a total of 160 stimuli were shown, including 40 repeated (target) items, 40 new (foil) items, and 80 lure items that were perceptually similar (but not identical) to the studied items. Of the 80 lure items, 40 lures were very similar to the targets (high lures) and 40 lures were less similar to the targets (low lures). Participants were asked to indicate by a keypress whether an object was the “same” or “different”. For the MDTS, the same images were shown as in the study phase, 40 of which were presented in the same locations (targets) and 120 of which were presented in different locations. The distance from the initial presentation varied across incremental levels to manipulate spatial similarity (i.e., novel location for corner-to-corner dislocation, low similarity for positions in a different quadrant of the grid, high similarity for different position within the same quadrant). Participants were asked to indicate by a keypress whether an object was presented in the “same” or “different” position. Participants were allowed 2 s to make a response before the next stimulus appeared. Each participant saw a unique order of stimuli for each phase for both versions.
Fig. 1.
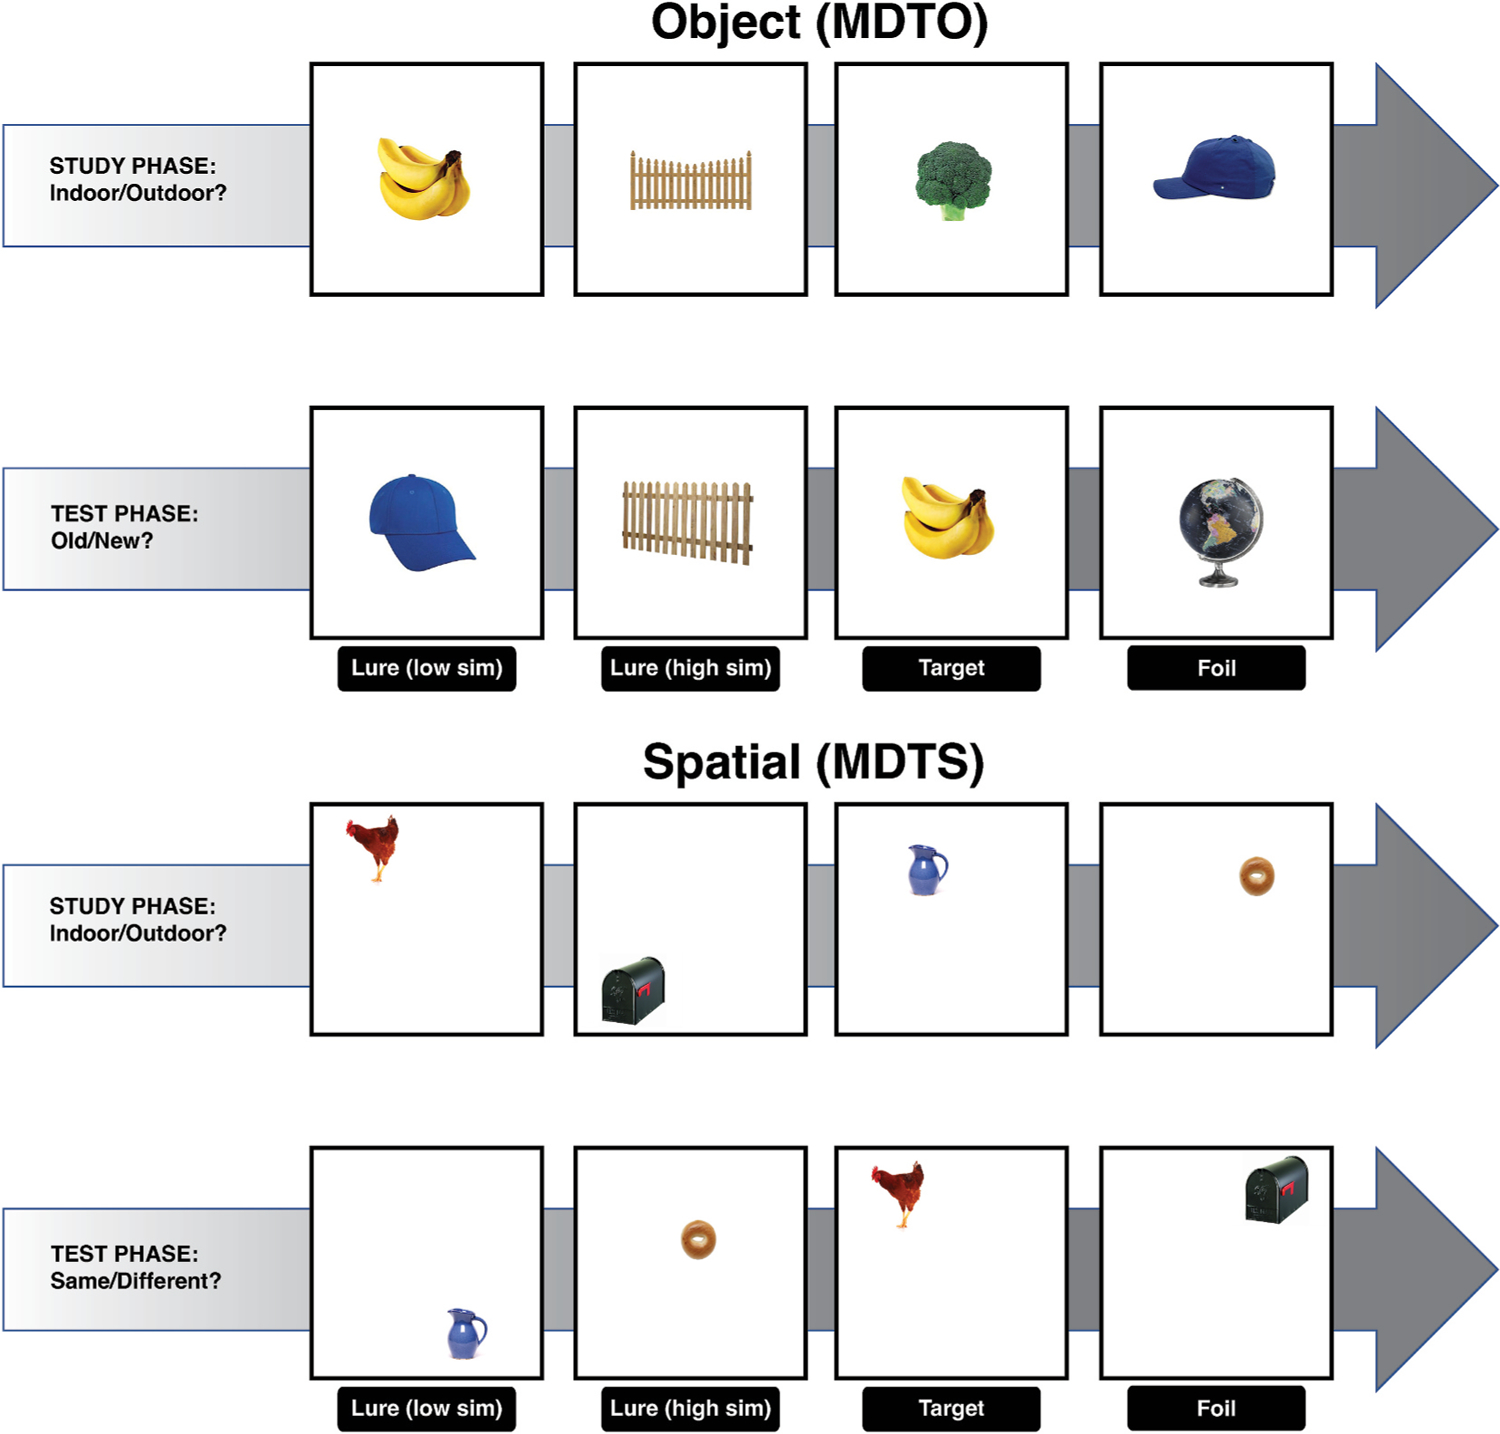
The mnemonic discrimination tasks (MDTs). An illustrative diagram of MDTs for object (MDTO) and spatial (MDTS) domains. Object stimuli size relative to screen size is smaller in the actual task. For each trial, an object image was presented for 2 s (ISI = 0.5sec) in the center of the screen (MDTO) or in a random grid position within the screen (MDTS). During the study phase, participants saw a series of object stimuli and were asked to indicate whether an item belonged “indoor” or “outdoor” objects using a key press. For the test phase, participants were asked to indicate by a keypress whether an object (MDTO) or object location (MDTS) was the “same” or “different”. Participants were allowed 2 s to make a response before the next stimulus appeared. Each participant saw a unique order of stimuli for each phase.
For both MDTO and MDTS, mnemonic discrimination performance was assessed using a bias-corrected Lure Discrimination Index (LDI), defined as the proportion of lures correctly identified minus the proportion of targets incorrectly identified (p[‘Different’|lures]-p [‘Different’| targets]). We averaged values from LDI of high and low lures. We also calculated LDI as a function of similarity levels (i.e., LDI slope = LDI for low lures minus LDI for high lures). D prime measures, based on classic signal detection theory (Snodgrass and Corwin, 1988), were also calculated for targets, high lures, and low lures based on the equation, d’ = Z (Target hit rate) – Z (False alarm rate). Recognition memory performance was calculated as the probability of correctly responding to repeated target objects (hits) minus the probability of incorrectly responding to foil objects (false alarms). All the five variables were included as input features.
2.7. Random forest classification
Random forest (RF) classification models were constructed for prediction of cognitive status (cognitively normal or MCI) and Aβ status (low or high, in cognitively normal participants). Random forest (Breiman, 2001) is a type of ensemble machine learning algorithm that has been widely used for classification or regression models (Fernandez-Delgado et al., 2014). We chose this method based on several advantages in terms of high accuracy, resistance to overfitting and outliers, and robust handling of small samples with class imbalance (Caruana and Niculescu-Mizil, 2006; Fernandez-Delgado et al., 2014). Owing to its utility, random forest methods have been applied in AD studies using large scale data sets such as ADNI (Dimitriadis et al., 2018). An RF classifier selects a random sample of the training data and forms numerous decision trees that learn decision rules from multiple features of the data. Then in a test dataset, prediction of each tree generates the mode of the outcome classes of interest.
We developed and implemented RF algorithms in Python (version 3.8.8) using the Scikit-Learn library (Pedregosa et al., 2011) and built 100 decision trees consisting of different combinations of predictor variables. The predictors or input features consisted of performance scores from MDT, RAVLT, or MMSE. Demographic features (age, sex, education) were also considered in some prediction models. Additionally, we utilized the Gini impurity index (Breiman, 2001), a commonly employed feature selection strategy in RF classification, to assess relative importance of features contributing to model prediction.
Sensitivity and specificity of the models were determined using 0.5 as a threshold. Model performance was then evaluated using the area under the curve (AUC) of the receiver operating characteristic (ROC) curves, which was plotted from all the predicted values of the test data set using leave-one-out cross validation (LOOCV). We specifically chose the LOOCV design given the small sample size (Falahati et al., 2014) and built n classification models using n-1 subject each time and then used the classifier to determine the class of the left out subject. We then performed bootstrapping method (1000 resampling with replacement) to estimate 95% confidence intervals (CI) of the average cross-validated AUCs. DeLong’s method was used to test for significant differences between the AUCs of two models (Delong et al., 1988; Sun and Xu, 2014).
2.8. Statistical analysis
All statistical analyses were performed using the open-source statistical software package R (www.r-project.org/). DeLong’s test was performed using the ‘pROC’ package in R. We ran independent two sample t-tests for comparison of demographics and neuropsychological variables between CN and MCI as well as between high Aβ and low Aβ groups. Pearson’s correlation between MDTO, MDTS, and RAVLT was computed to assess collinearity among predictors. Area under the ROC curves were estimated and plotted using Scikit-Learn library implemented in Python (version 3.8.8).
3. Results
3.1. Demographic, neuropsychological, and clinical characteristics
Participant characteristics are summarized in Table 1, and different types of scores of MDTs are summarized in Supplemental Table 1. Average age (yrs ± SD) of cognitively normal (CN) participants and participants with MCI diagnosis was 71.7 ± 6.6 and 76.5 ± 9.6, respectively. There was a significant difference in age (p = 0.05) but not in education level (p = 0.62) between the CN and MCI groups. In both groups, there were more females than males and participants were predominantly non-Hispanic white. The MCI group performed more poorly than the CN group on MMSE, immediate and delayed recall on RAVLT, and most of the MDT performance metrics (ps < 0.05). Cognitively normal adults were further divided into two groups based on the level of Aβ. There was no group difference in any measures, except for the learning slope of RAVLT (p = 0.05). A few participants reported having a comorbid condition (5 diabetes and 2 heart disease).
3.2. Correlations among MDTO and MDTS metrics
Pearson’s correlation coefficients between performance scores of MDTO and MDTS are summarized in Table 2, and scatter plots are shown in Supplemental Fig. 1. Overall, the LDI scores of MDTO and MDTS had the highest correlation (r = 0.452, p < 0.001) compared to other pairs of scores. Lure discrimination index of MDTO had significant correlation with MDTS LDI, recognition, and d’ (ps < 0.001). Recognition score of MDTO also had a strong correlation with LDI and recognition score of MDTS (ps < 0.001). Discrimination performance on high spatial lures was significantly associated with MDTO LDI (p < 0.05). Similarly, discrimination performance on low spatial lures had significant association with MDTO performance, mainly the LDI and recognition (ps < 0.05). When we applied Holm’s correction (Holm, 1979) for multiple correlations, correlations remained statistically significant between MDTO LDI and MDTS LDI, as well as between the recognition score of MDTS and all the MDTO scores.
Table 2.
Pearson correlation coefficients among MDTO and MDTS scores.
| MDTS LDI | MDTS Rec | MDTS d’ | MDTS d’H | MDTS d’L | |
|---|---|---|---|---|---|
| MDTO LDI | .452*† | .425*† | .307*† | .198* | .217* |
| MDTO Rec | .337*† | .445*† | .205* | .102 | .197* |
| MDTO d’ | .176 | .310*† | .112 | .001 | .063 |
| MDTO d’H | .173 | .297*† | .155 | .062 | .022 |
| MDTO d’L | .195 | .313*† | .171 | .082 | .058 |
MDTO = object version of the mnemonic discrimination task, MDTS = spatial version of the mnemonic discrimination task, LDI = lure discrimination index, Rec = recognition, d’H = d’ for high similarity lures, d’L = d’ for low similarity lures,
significant, uncorrected p < 0.05,
significant, corrected (Holm’s) p < 0.05.
3.3. Correlations among MDTO and RAVLT metrics
Pearson’s correlation coefficients between performance scores of MDTO and RAVLT are summarized in Table 3, and scatter plots are shown in Supplemental Fig. 2. Lure discrimination index, recognition, and d’ scores of MDTO showed significant correlation with immediate recall score (A6) of RAVLT (ps < 0.05). LDI, recognition and d’ scores showed significant correlation with delayed recall score (A7) of RAVLT (ps < 0.05). All the scores in MDTO had negative correlation with rate of forgetting the word list in RAVLT; however, only recognition and d’ scores had significant association (ps < 0.05). No scores in MDTO were significantly associated with learning capacity of the word list in RAVLT. A6 remained significantly correlated with MDTO LDI and recognition score after applying Holm’s correction method.
Table 3.
Pearson correlation coefficients among MDTO and RAVLT scores.
| A6 | A7 | LS | RI | FR | |
|---|---|---|---|---|---|
| MDTO LDI | .317*† | .228* | .048 | .280* | −.166 |
| MDTO Rec | .306*† | .271* | .005 | .273* | −.257* |
| MDTO d’ | .240* | .237* | .072 | .196* | −.221* |
| MDTO d’H | .210* | .182 | .055 | .195* | −.173 |
| MDTO d’L | .225* | .164 | .026 | .217* | −.147 |
MDTO = object version of the mnemonic discrimination task, RAVLT = Rey auditory verbal learning test, LDI = lure discrimination index, Rec = recognition, d’H = d’ for High similarity lures, d’L = d’ for low similarity lures, LS = learning slope, RI = retrospective interference, FR = forgetting rate,
significant, uncorrected p < 0.05,
significant, corrected (Holm’s) p < 0.05.
3.4. Correlations among MDTS and RAVLT metrics
Pearson’s correlation coefficients between performance scores of MDTO and RAVLT are summarized in Table 4, and scatter plots are shown in Supplemental Fig. 3. As in MDTO scores, lure discrimination index, recognition, and d’ scores of MDTS showed significant correlation with immediate recall score (A6) of RAVLT or delayed recall score (A7) (ps < 0.05). All the scores in MDTO had negative correlation with rate of forgetting the word list in RAVLT, however, only LDI and recognition scores had significant association (ps < 0.05). No scores in MDTS were significantly associated with learning capacity of the word list in RAVLT. A6 remained significantly correlated with MDTS recognition score after applying Holm’s correction method.
Table 4.
Pearson correlation coefficients among MDTS and RAVLT scores.
| A6 | A7 | LS | RI | FR | |
|---|---|---|---|---|---|
| MDTS LDI | .295* | .296* | .106 | .247* | −.267* |
| MDTS Rec | .318*† | .286* | .091 | .252* | −.240* |
| MDTS d’ | .259* | .212* | −.006 | .202* | −.163 |
| MDTS d’H | .112 | .072 | −.034 | .110 | −.064 |
| MDTS d’L | .096 | .053 | −.046 | .115 | .041 |
MDTS = spatial version of the mnemonic discrimination task, RAVLT = Rey auditory verbal learning test, LDI = lure discrimination index, Rec = recognition, d’H = d’ for High similarity lures, d’L = d’ for low similarity lures, LS = learning slope, RI = retrospective interference, FR = forgetting rate,
significant, uncorrected p < 0.05,
significant, corrected (Holm’s) p < 0.05.
3.5. Model performance on classification of cognitive status
Table 5 and Fig. 2 demonstrate performance of random forest classification model by area under the curve (AUC) of the ROC curves, specificity, and sensitivity. A prediction model combining 5 types of scores (LDI, target recognition, d’ for target, d’ for high lures, d’ for low lures) from both MDTO and MDTS achieved an AUC of 0.834 (CI 95% bootstrap = 0.833, 0.835) for distinguishing individuals with normal cognition from MCI (Fig. 2A, Table 5). We found weaker performance when employing 5 types of scores (A6, A7, learning rate, retrospective interference, forgetting rate) from RAVLT (AUC = 0.555, CI 95% bootstrap = 0.554, 0.557). The two AUCs were statistically different (DeLong’s test, p = 0.01). There was a similar trend when demographics (age, sex, education level) were added to each model (AUC = 0.805 and 0.634 for MDT-based and RAVLT-based predictions, respectively). In fact, the RAVLT-based model performance was weaker than a model predicting with MMSE scores (AUC = 0.716, CI 95% bootstrap = 0.715, 0.717). Models using age, sex, and education level as a single predictor showed weaker performance than models employing MDT scores as predictors (AUCs <0.540).
Table 5.
Model performance evaluation metrics.
| Classification | Features | AUC [CI] | Sensitivity (%) [CI] | Specificity (%) [CI] |
|---|---|---|---|---|
| Cognitive status (CN vs. MCI) | MDT | .834 [.833 .835] | 34.3 [33.8 34.8] | 93.0 [93.0 93.1] |
| RAVLT | .555 [.554 .557] | 16.6 [15.8 17.5] | 91.7 [91.6 91.7] | |
| Aβ status (Low vs. High) | MDT | .638 [.637 .639] | 47.0 [46.6 47.3] | 73.9 [73.8 74.0] |
| RAVLT | .578 [.577 .578] | 47.1 [46.8 47.4] | 74.7 [74.6 74.8] |
AUC = area under the curve, CI = 95% confidence intervals, CN = cognitively normal, MCI = mild cognitive impairment, MDT = mnemonic discrimination task, RAVLT = Rey auditory verbal learning test.
Fig. 2.
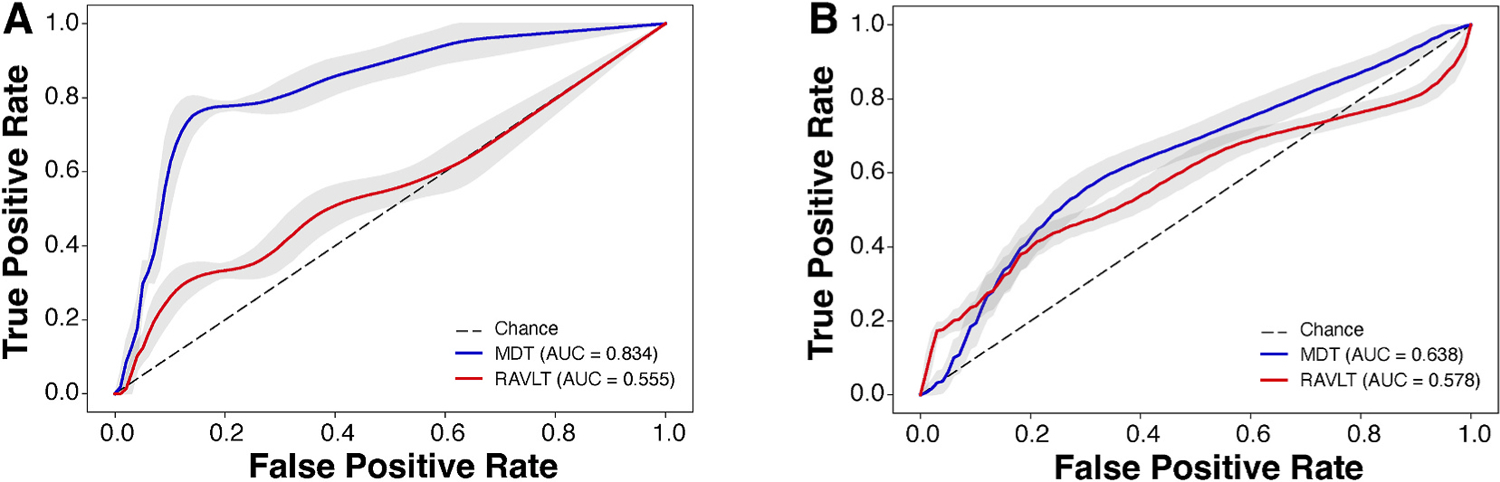
Receiver operating characteristic curves for random forest classification models using MDT performance metrics (blue) and RAVLT performance metrics (red) for cognitive status (A) and amyloid load (B) prediction. MDT = mnemonic discrimination task, RAVLT = Rey auditory verbal learning test, Dotted line = chance.
Gini impurity-based feature importance was plotted for each model (Fig. 3). The three most informative MDT features were MDTS d’, MDTO recognition, and MDTO d’ (Fig. 3A). For RAVLT, the three most informative features (Fig. 3B) were retrospective interference, immediate recall, and forgetting rate. Feature engineering was performed by selecting the most informative feature (Top 1) and then adding up to three most informative features (Top 1 and 2; Top 1, 2, and 3). For both MDT-based and RAVLT-based models, addition of features enhanced model performance (AUCs tabulated within Fig. 3A and B). On another feature engineering analysis, when recognition scores were excluded, a smaller AUC was achieved (0.79) than the model including all the MDT performance metrics (AUC = 0.83).
Fig. 3.
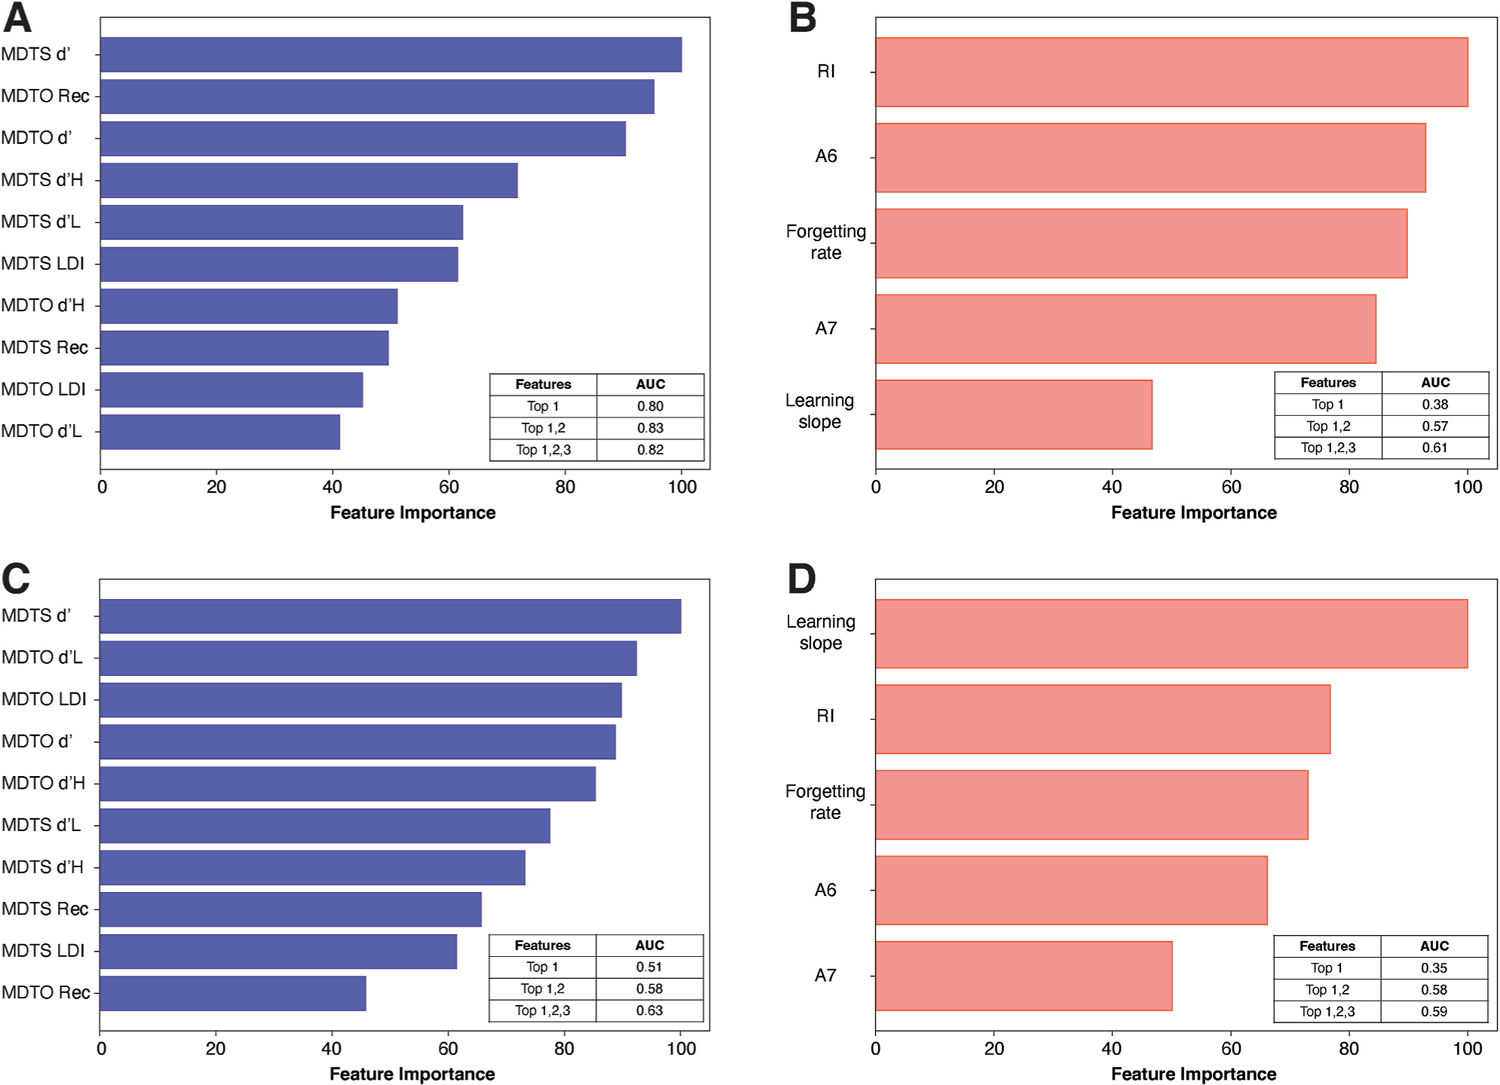
Ranked feature importance among the 10 features of the mnemonic discrimination tasks (A and C) and 5 features of Rey-auditory verbal learning task (B and D) for classification of cognition (A and B) and classification of amyloid status (C and D). Areas under the curve (AUC) for model performance based on the most informative features (up to 3) are tabulated within each plot. MDTO = object version of the mnemonic discrimination task, MDTS = spatial version of the mnemonic discrimination task, Rec = recognition, d’H = d’ for high similarity lures, d’L = d’ for low similarity lures, LDI = lure discrimination index, RI = retrospective interference, A6 = immediate recall, A7 = delayed recall.
To examine whether prediction performance varies between MDT domains (object vs. spatial), we compared model performance of RF classifiers when MDTO and MDTS features were separately employed (Supplemental Figs. 4A–D). A prediction model using MDTO performance metrics achieved an AUC of 0.86, which was numerically higher than the model using both MDTO and MDTS features (AUC = 0.83). This AUC value was higher than that of the MDTS-based model (AUC = 0.75). In the MDTO model, the recognition score emerged as the most informative feature, whereas, in the MDTS model, it was ranked as the least informative.
A joint model combining features from both MDT and RAVLT was considered (Supplemental Fig. 5). The joint model performance did not improve (AUC = 0.81) compared to the MDT-based model with an AUC of 0.83 (Supplemental Fig. 5A). Performance metrics of MDT (e.g., MDTO d’, MDTO Rec, MDTS d’) were ranked as more informative features than RAVLT scores (Supplemental Fig. 5B).
3.6. Model performance on classification of Aβ status in cognitively normal older adults
The best model predicting low versus high Aβ burden was achieved for the model in which all the 5 types of scores from both MDTO and MDTS were used ((Fig. 2B, Table 5), yielding an AUC of 0.638 (CI 95% bootstrap = 0.637, 0.639). This performance was superior to that of the model employing the 5 types of scores from RAVLT (AUC = 0.578, CI 95% bootstrap = 0.577, 0.578). The two AUCs were statistically not different (DeLong’s test, p = 0.77). When demographics (age, sex, education level) were included as features, MDT-based model (AUC = 0.650, CI 95% bootstrap = 0.649, 0.651) was still superior to RAVLT-based model (AUC = 0.529, CI 95% bootstrap = 0.528, 0.530). Compared to the models employing MDT scores, models employing age (AUC = 0.595, CI 95% bootstrap = 0.594, 0.595), sex (AUC = 0.307, CI 95% bootstrap = 0.307, 0.308), education level (AUC = 0.329, CI 95% bootstrap = 0.326, 0.332), or MMSE scores (AUC = 0.517, CI 95% bootstrap = 0.516, 0.518) as a single predictor demonstrated weaker performance. Interestingly, a model employing the LDI slope as a single feature achieved comparable performance (AUC = 0.648) as the model including all the MDT features and demographics.
Gini impurity-based feature importance was plotted for each model. The three most informative MDT features were MDTS d’, MDTO d’ low similarity lures, and MDTO LDI (Fig. 3C). Recognition scores of MDTS and MDTO were less informative features (8th and 10th, respectively). For RAVLT, the three most informative features were learning slope, retrospective interference, and forgetting rate (Fig. 3D). Feature engineering was performed by selecting the most informative feature (Top 1) and then adding up to three most informative features (Top 1 and 2, Top 1, 2, and 3). For both MDT and RAVLT models, addition of features also enhanced model performance (AUCs tabulated within Fig. 3C and D). On another feature engineering analysis, exclusion of recognition scores had little impact on model performance (AUC = 0.66) compared to the model including all the MDT performance metrics (AUC = 0.64).
To examine if prediction performance varies between MDT domains (object vs. spatial), we compared model performance of RF classifiers when MDTO and MDTS features were separately employed (Supplemental Figs. 4E–H). A prediction model using features from MDTO performance metrics achieved an AUC of 0.63, which was similar to the model using both MDTO and MDTS features (AUC = 0.64). The MDTO-based model yielded a marginally higher AUC than the MDTS-based model (AUC of 0.60). For each MDTO and MDTS model, recognition scores were the least informative feature.
A joint model combining features from MDT and RAVLT was considered (Supplemental Fig. 5). The joint model performance remained consistent (AUC = 0.65) compared to the MDT-based model with an AUC of 0.64 (Supplemental Fig. 5C). Recognition scores of MDT and recall scores (A6 and A7) of RAVLT ranked as the least informative features (Supplemental Fig. 5D).
4. Discussion
In this study, we evaluated the diagnostic utility of the mnemonic discrimination tasks for cross-sectionally identifying cognitively normal older individuals from individuals with a clinical diagnosis of MCI, as well as for statistically predicting cerebral Aβ burden (measured by FBP-PET or CSF) among cognitively normal older adults. We trained a random forest classifier by including various MDT performance scores as input features. For comparisons, we also trained random forest classifiers by including performance metrics from a commonly used neuropsychological assessment (RAVLT) or a MMSE score. Model performance was evaluated based on the AUC of ROC curves. For classification of cognitive status, the MDT-based model outperformed the RAVLT-based model with a higher AUC (0.83 vs. 0.56, DeLong’s test, p < 0.05). For classification of Aβ status, the MDT-based model yielded a numerically higher AUC than the RAVLT-based model (0.64 vs. 0.53), but the AUCs were not statistically different (DeLong’s test, p > 0.5). For both classifications, MDT recognition scores had a minimal impact on model performance. Furthermore, combining MDT and RAVLT features did not enhance classification compared to models that used MDT performance metrics as features. Overall, RF classifiers based on MDT performance metrics yielded numerically greater AUC values than classifiers based on RAVLT performance metrics.
A key aspect of the MDT is its ability to engage the hippocampal-dependent process (pattern separation) that supports discrimination of highly similar representations. Notably, a body of literature (Aggleton and Shaw, 1996; Holdstock et al., 2005; Mayes et al., 2002) has demonstrated sparing of recognition memory following hippocampal lesions, suggesting that recognition and mnemonic discrimination are two distinct cognitive processes. This idea leads to an interesting question: how might including recognition scores impact the performance of our MDT-based classifiers? In our classifications of cognition or Aβ status, recognition scores had minimal impact on model predictions, resulting in marginal changes in the AUC values. Moreover, recognition scores ranked as less informative features for classification of Aβ load in cognitively normal individuals. These findings are in line with the idea that recognition remains largely intact over healthy aging (e.g.., Stark et al., 2013) and demonstrate that predicting AD-related pathology based on recognition performance may not yield sufficient discrimination.
A line of research exploring the domain-specific (object and spatial) functional pathways in the MTL (Ranganath and Ritchey, 2012) may offer relevant insights into to our results comparing the discriminative value of MDTO and MDTS. These functional pathways operate separately for object information through the perirhinal-lateral entorhinal cortex and spatial information through the parahippocampal-medial entorhinal cortex, which are also thought to be crucial for MDTO and MDTS, respectively (Reagh and Yassa, 2014). Importantly, the transitional region including the lateral entorhinal and perirhinal cortex is known to be vulnerable to accumulation of AD-related pathology (primarily tau pathology, Braak and Braak, 1991), overlapping with the object processing pathway that supports MDTO. In our classification of CN and MCI, we found that that the MDTO-based model achieved a higher AUC value of 0.86, surpassing the model that exclusively used MDTS features (AUC = 0.75). While this result is in line with other reports demonstrating impaired MDTO performance in MCI (Bakker et al., 2012; Stark et al., 2013), there is still lack of evidence supporting which domain serves as the superior tool for clinical diagnosis. We also compared model performance between MDTO and MDTS for prediction of Aβ status but found little difference (AUC = 0.63 vs. 0.60). One possibility is that, because MDTO and MDTS metrics were correlated, it was expected that no specific domain outperforms the other. Another possibility is that the domain difference may track tau pathology better than Aβ, given the susceptibility of the transentorhinal region to the pathology (Berron et al., 2018, 2019; Braak and Braak, 1991), which invites future work examining the domain-specific diagnostic value for prediction of tau burden.
For classification of cognition, we found that the RAVLT-based model marginally benefited with addition of demographic features. We also trained RF classifiers using combined features from both MDT and RAVLT, and this joint model performance substantially improved (AUC = 0.81) compared to the RAVLT-based model (AUC = 0.56). A few points may help explain these findings. First, MCI is recognized as a heterogeneous category, encompassing a wide range of demographics, cognitive or clinical symptoms, and pathological severity. Due to this heterogeneity, we expect the clinical diagnosis may not achieve perfect performance (i.e., AUC close 1.0). In this regard, our MDT-based classifier may have already reached a near-ceiling level of performance (AUC >0.8), and further improvement may not be possible. Second, MDT performance may be more sensitive to age (e.g., decline starting to emerge in the 4th decade of life) than RAVLT performance (Stark et al., 2013). It is plausible that MDT performance already accounts for age-related effects and therefore, addition of age or demographic features may have had little impact on model predictions. Overall, our findings suggest that MDT may be an effective diagnostic tool and able to provide complementary information to cognitive assessments used for diagnosis of AD.
A wealth of studies have utilized machine learning techniques and integrated combined features from biomarkers and neuropsychological scores for discrimination of healthy controls from AD patients (Clark et al., 2014; Ewers et al., 2012; Spasov et al., 2019), for discrimination of MCI from AD (Ardekani et al., 2017; Clark et al., 2016; Grassi et al., 2019; Moradi et al., 2015; Velazquez et al., 2021; Zhang et al., 2011), or for discrimination of normal cognition from MCI (Cui et al., 2012; Gray et al., 2013; Lebedeva et al., 2017). Most of these investigations yielded AUCs ranging from 0.7 to 0.9, suggesting that biomarker data derived from neuroimaging, CSF assays, or genotyping play a crucial role in achieving powerful classification of cognition along the AD continuum. A fundamental question remains whether cognitive test metrics can adequately replace the need of acquiring invasive and expensive biomarker data. While conversion to AD from MCI is a stage that may be readily detectable with standard neuropsychological measures across multiple cognitive domains, conversion from cognitively normal to MCI is perhaps a more subtle and less common trajectory. Consequently, more sensitive and specific cognitive tests are required to predict the transition to MCI, which is a critical window for potential intervention. Our findings illustrate that by probing memory measures (MDT) rooted in neurobiological process (pattern separation) and known to be sensitive to cognitive decline, predicting conversion from cognitively normal to MCI may be achievable.
We also examined whether MDT performance may predict risks of cerebral Aβ burden in older adults with normal cognition. A few studies recently proposed different machine-learning approaches for predicting risks for cerebral Aβ positivity, but mostly in MCI or prodromal AD patients (Ezzati et al., 2020; Haghighi et al., 2015; Kandel et al., 2015; Kim et al., 2018, 2021; Palmqvist et al., 2019) reporting a range of AUCs between 0.6 and 0.8. Our classification performance for Aβ status was generally weaker than classification for clinical diagnosis. One potential explanation is that features like neuroimaging data, APOE genotype, or biomarkers exhibit higher discriminatory power in detecting AD pathology, whereas cognitive impairment alone may not be sufficient to differentiate pathological burden. Another possibility is that Aβ accumulation is prevalent in cognitively normal older adults (Jack and Holtzman, 2013) and is only weakly associated with cognitive changes. In contrast to tau, which tends to be regionally concentrated around the medial temporal lobe in preclinical AD (Braak and Braak, 1991), the distribution of Aβ plaques is widespread throughout the brain (Thal et al., 2002). Therefore, performance on MDT, which taps into medial temporal lobe integrity, may not exhibit a strong association with Aβ pathology. As suggested above, future work is needed to examine the diagnostic value of MDTs for prediction of tau burden.
Though not based on machine-learning approaches, some recent studies (Jutten et al., 2021a; Papp et al., 2021; Trelle et al., 2021; Webb et al., 2020) are worth noting for demonstrating a close relationship between MDT performance and AD pathology in various cognitively normal cohorts. Papp et al. (2021), for example, used a variant of the MDTO (labelled as the Behavioral Pattern Separation Test-Object [BPSO]) and demonstrated significant differences between a large sample (n = 4486) of Aβ + and Aβ – individuals. Aβ or tau burden was also found to be related to lure discrimination scores particularly as a function of similarity level in cognitively normal older adults, a pattern which was observed in both MDTO (Trelle et al., 2021) and MDTS (Webb et al., 2020). While there are methodological and analytical differences among the studies, the results are in line with our finding that MDT performance metrics may be a useful tool for early detection of AD-related pathology in cognitively normal older adults.
With the growing number of large data sets, machine learning has emerged as a useful diagnostic approach in numerous clinical and non-clinical domains. Among several ensemble learning techniques available (Caruana and Niculescu-Mizil, 2006; Fernandez-Delgado et al., 2014), we chose the random forest classifier given its advantages for effective handling of small or imbalanced data and capability of solving overfitting problems (Dietterich, 2000). Another strength of the RF classifier is that relative feature importance can be derived, providing additional explanations for prediction models. In recent review papers, classification results from studies using RF classifiers (Sarica et al., 2017) or other prediction methods (e.g., support vector machine, neural network) (Weiner et al., 2017) for clinical diagnosis of AD have been summarized. A study by Velazquez et al. (2021) particularly provided comparisons among RF classifier, support vector classifier, logistic regression, and XGBoost classifier, and found RF was the best method for AD conversion prediction. Collectively, previous reports demonstrate the utility of RF classifiers as an early screening tool to identify individuals who will likely develop AD and require intervention.
In addition to the use of RF classification algorithms, strengths of our study include our focus on discrimination of CN and MCI in the early stage of AD, which provide opportunities for identifying at-risk individuals prior to any clinical diagnosis. Moreover, our study participants have been deeply phenotyped with regards to their cognitive and clinical profiles. Our study is also among the few studies leveraging rich, comprehensive datasets to examine the diagnostic capacity of cognitive tests for cerebral Aβ status, which can otherwise be measured by invasive and expensive means. The MDT can be briefly and easily administered in several domains (object, spatial, temporal) and in different platforms (in person or online) (Jutten et al., 2021a). Furthermore, compared to RAVLT that primarily rely on verbal memory, the MDT stimuli are based on object images and therefore can be widely available for diverse population speaking different languages (e.g., see Suwabe et al., 2017).
The main limitation of our study is the small and unbalanced sample size (e.g., MCI, n = 9) compared to other studies using large-scale databases (e.g., ADNI cohort). Thus, our statistical power for classification may be somewhat limited and warrants cautious interpretation of the findings. Although we were not able to test our RF classifiers on an independent dataset, we mitigated this issue by using the leave-one-out cross validation that is considered the preferred method for smaller datasets (Falahati et al., 2014). We also note that sensitivity values of our models were quite low (16%–47%) (Table 5). Given the imbalance in the class of the participant groups, we suggest that little importance can be assigned to the divergence of the specificity and sensitivity values. This emphasizes the importance of obtaining confidence intervals for these measures. Consider for example, a study by Wang et al. (2017) which investigated the use of event related potentials to identify individuals at risk of presenting delayed onset post-traumatic stress disorder. The participant groups in this study were unbalanced (60 Stables, 5 Converters). In this case on a first examination the results were encouraging (sensitivity = 0.80, specificity = 0.87), but the confidence intervals for both measures were found to be [0.0, 1.0]. The sensitivity and specificity results were seen to be a fortuitous consequence of the small sample size. Similarly, in the current investigation, the divergence of the sensitivity or specificity results may be a consequence of an unbalanced design.
Another limitation of our study is that our participants were predominantly non-Hispanic white with high educational attainment, which necessitates future studies with a larger and more diverse sample. Also, our participants were generally free of other neuropsychiatric conditions (e.g., depression), which may make our findings less generalizable to the broader aging population. Given the relatively high prevalence of neuropsychiatric disorders in preclinical AD (Ownby et al., 2006), future studies should consider these conditions in their analyses. Lastly, our analyses were cross-sectional, making it challenging to examine how MDT performance may predict subsequent cognitive or neuropathological changes. Future work with longitudinal data will provide much insight into this potential relationship.
5. Conclusion
In summary, we have demonstrated that the MDT has a diagnostic utility in classifying AD-related cognitive impairment as well as Aβ burden in a preclinical AD population. Our findings indicate that utilizing cost- and time-efficient digital cognitive assessments can effectively predict cognitive status or AD-related pathology, replacing the need for expensive and invasive measures. This approach can serve as an initial screening tool, guiding clinical decision-making without subjecting individuals to risky and financially burdensome assessments. Furthermore, the machine-learning techniques employed in this research can be extended to other datasets, including diverse ethnic and racial populations. This extension represents a crucial direction for future research, enhancing the applicability and generalizability of the findings.
Supplementary Material
Acknowledgement
This work was supported by the BEACoN Study – NIA R01AG053555 (to M.A.Y.), the UCI Alzheimer’s Disease Research Center (NIA P50AG16573; PI: LaFerla, F., Project PI: M.A.Y), NIA F31AG074703 (to M.G.C-F), and NIA F32AG074621 (to J.N.A).
Footnotes
Credit author statement
Soyun Kim: Conceptualization, Methodology Validation, Formal analysis, Investigation, Writing – original draft, Writing – review & editing, Visualization.Jenna N. Adams: Resources, Data curation, Writing – review & editing. Miranda G. Chappel-Farley: Formal analysis, Writing – review & editing.David Keator: Software. John Janecek: Software. Lisa Taylor: Resources, Data curation. Abanoub Mikhail: Resources, Data curation. Martina Hollearn:Resources. Liv McMillan: Resources, Project administration. Paul Rapp: Investigation, Writing – review & editing. Michael A. Yassa: Conceptualization, Methodology/Study design, Investigation, Writing – review & editing, Supervision, Project administration, Funding acquisition.
Declaration of competing interest
M.A.Y. is inventor on Augmem™ technology and is co-founder and chief scientific advisor of Augnition Labs, LLC, which is developing a commercial platform for mnemonic discrimination to aid in diagnosis. Augnition Labs took no part in funding or directing the science presented in this paper. No other conflicts of interest are reported.
The opinions and assertions herein do not necessarily reflect the official policy or position of the Uniformed Services University, the Department of Defense, or the Henry M. Jackson Foundation for the Advancement of Military Medicine.
Appendix A. Supplementary data
Supplementary data to this article can be found online at https://doi.org/10.1016/j.neuropsychologia.2023.108727.
Data availability
Data will be made available on request.
References
- Ackley SF, Zimmerman SC, Brenowitz WD, Tchetgen Tchetgen EJ, Gold AL, Manly JJ, Mayeda ER, Filshtein TJ, Power MC, Elahi FM, Brickman AM, Glymour MM, 2021. Effect of reductions in amyloid levels on cognitive change in randomized trials: instrumental variable meta-analysis. BMJ 372, n156. 10.1136/bmj.n156. [DOI] [PMC free article] [PubMed] [Google Scholar]
- Adams JN, Kim S, Rizvi B, Sathishkumar M, Taylor L, Harris AL, Mikhail A, Keator DB, McMillan L, Yassa MA, 2022. Entorhinal-hippocampal circuit integrity is related to mnemonic discrimination and amyloid-beta pathology in older adults. J. Neurosci 42 (46), 8742–8753. 10.1523/JNEUROSCI.1165-22.2022. [DOI] [PMC free article] [PubMed] [Google Scholar]
- Adams JN, Marquez F, Larson MS, Janecek JT, Miranda BA, Noche JA, Taylor L, Hollearn MK, McMillan L, Keator DB, Head E, Rissman RA, Yassa MA, 2023. Differential involvement of hippocampal subfields in the relationship between Alzheimer’s pathology and memory interference in older adults. Alzheimers Dement (Amst) 15 (2), e12419. 10.1002/dad2.12419. [DOI] [PMC free article] [PubMed] [Google Scholar]
- Aggleton JP, Shaw C, 1996. Amnesia and recognition memory: a re-analysis of psychometric data. Neuropsychologia 34 (1), 51–62. 10.1016/0028-3932(95)00150-6. [DOI] [PubMed] [Google Scholar]
- Aizenstein HJ, Nebes RD, Saxton JA, Price JC, Mathis CA, Tsopelas ND, Ziolko SK, James JA, Snitz BE, Houck PR, Bi W, Cohen AD, Lopresti BJ, DeKosky ST, Halligan EM, Klunk WE, 2008. Frequent amyloid deposition without significant cognitive impairment among the elderly. Arch. Neurol 65 (11), 1509–1517. 10.1001/archneur.65.11.1509. [DOI] [PMC free article] [PubMed] [Google Scholar]
- Albert MS, DeKosky ST, Dickson D, Dubois B, Feldman HH, Fox NC, Gamst A, Holtzman DM, Jagust WJ, Petersen RC, Snyder PJ, Carrillo MC, Thies B, Phelps CH, 2011. The diagnosis of mild cognitive impairment due to Alzheimer’s disease: recommendations from the National Institute on Aging-Alzheimer’s Association workgroups on diagnostic guidelines for Alzheimer’s disease. Alzheimers Dement 7 (3), 270–279. 10.1016/j.jalz.2011.03.008. [DOI] [PMC free article] [PubMed] [Google Scholar]
- Alcolea D, Pegueroles J, Munoz L, Camacho V, Lopez-Mora D, Fernandez-Leon A, Le Bastard N, Huyck E, Nadal A, Olmedo V, Sampedro F, Montal V, Vilaplana E, Clarimon J, Blesa R, Fortea J, Lleo A, 2019. Agreement of amyloid PET and CSF biomarkers for Alzheimer’s disease on Lumipulse. Ann Clin Transl Neurol 6 (9), 1815–1824. 10.1002/acn3.50873. [DOI] [PMC free article] [PubMed] [Google Scholar]
- Ardekani BA, Bermudez E, Mubeen AM, Bachman AH, Alzheimer’s Disease Neuroimaging I., 2017. Prediction of Incipient Alzheimer’s disease dementia in patients with mild cognitive impairment. J Alzheimers Dis 55 (1), 269–281. 10.3233/JAD-160594. [DOI] [PubMed] [Google Scholar]
- Arnold SE, Hyman BT, Flory J, Damasio AR, Van Hoesen GW, 1991. Jan-Feb). The topographical and neuroanatomical distribution of neurofibrillary tangles and neuritic plaques in the cerebral cortex of patients with Alzheimer’s disease. Cerebr. Cortex 1 (1), 103–116. 10.1093/cercor/1.1.103. [DOI] [PubMed] [Google Scholar]
- Arriagada PV, Marzloff K, Hyman BT, 1992. Distribution of Alzheimer-type pathologic changes in nondemented elderly individuals matches the pattern in Alzheimer’s disease. Neurology 42 (9), 1681–1688. 10.1212/wnl.42.9.1681. [DOI] [PubMed] [Google Scholar]
- Bakker A, Kirwan CB, Miller M, Stark CE, 2008. Pattern separation in the human hippocampal CA3 and dentate gyrus. Science 319 (5870), 1640–1642. 10.1126/science.1152882. [DOI] [PMC free article] [PubMed] [Google Scholar]
- Bakker A, Krauss GL, Albert MS, Speck CL, Jones LR, Stark CE, Yassa MA, Bassett SS, Shelton AL, Gallagher M, 2012. Reduction of hippocampal hyperactivity improves cognition in amnestic mild cognitive impairment. Neuron 74 (3), 467–474. 10.1016/j.neuron.2012.03.023. [DOI] [PMC free article] [PubMed] [Google Scholar]
- Belliart-Guerin G, Planche V, 2023. Mnemonic discrimination performance in a memory clinic: a pilot study. J Alzheimers Dis 94 (4), 1527–1534. 10.3233/JAD-230221. [DOI] [PMC free article] [PubMed] [Google Scholar]
- Bennett IJ, Stark SM, Stark CEL, 2019. Recognition memory dysfunction relates to hippocampal subfield volume: a study of cognitively normal and mildly impaired older adults. J. Gerontol. B Psychol. Sci. Soc. Sci 74 (7), 1132–1141. 10.1093/geronb/gbx181. [DOI] [PMC free article] [PubMed] [Google Scholar]
- Berron D, Cardenas-Blanco A, Bittner D, Metzger CD, Spottke A, Heneka MT, Fliessbach K, Schneider A, Teipel SJ, Wagner M, Speck O, Jessen F, Duzel E, 2019. Higher CSF tau levels are related to hippocampal hyperactivity and object mnemonic discrimination in older adults. J. Neurosci 39 (44), 8788–8797. [DOI] [PMC free article] [PubMed] [Google Scholar]
- Berron D, Neumann K, Maass A, Schutze H, Fliessbach K, Kiven V, Jessen F, Sauvage M, Kumaran D, Duzel E, 2018. Age-related functional changes in domain-specific medial temporal lobe pathways. Neurobiol. Aging 65, 86–97. 10.1016/j.neurobiolaging.2017.12.030. [DOI] [PubMed] [Google Scholar]
- Besser L, Kukull W, Knopman DS, Chui H, Galasko D, Weintraub S, Jicha G, Carlsson C, Burns J, Quinn J, Sweet RA, Rascovsky K, Teylan M, Beekly D, Thomas G, Bollenbeck M, Monsell S, Mock C, Zhou XH, Thomas N, Robichaud E, Dean M, Hubbard J, Jacka M, Schwabe-Fry K, Wu J, Phelps C, Morris JC, Neuropsychology Work Group D., 2018. Version 3 of the National Alzheimer’s coordinating center’s Uniform data set. Alzheimer Dis. Assoc. Disord 32 (4), 351–358. 10.1097/WAD.0000000000000279. [DOI] [PMC free article] [PubMed] [Google Scholar]
- Braak H, Braak E, 1991. Neuropathological stageing of Alzheimer-related changes. Acta Neuropathol. 82 (4), 239–259. [DOI] [PubMed] [Google Scholar]
- Breiman L, 2001. Random forests. Mach. Learn 45 (1), 5–32. [Google Scholar]
- Caruana R, Niculescu-Mizil A, 2006. An empirical comparison of supervised learning algorithms. Proceedings of the 23rd international conference on Machine learning, pp. 161–168. [Google Scholar]
- Clark DG, Kapur P, Geldmacher DS, Brockington JC, Harrell L, DeRamus TP, Blanton PD, Lokken K, Nicholas AP, Marson D, 2014. Latent information in fluency lists predicts functional decline in persons at risk for Alzheimer disease. Cortex 55, 202–218. 10.1016/j.cortex.2013.12.013. [DOI] [PMC free article] [PubMed] [Google Scholar]
- Clark DG, McLaughlin PM, Woo E, Hwang K, Hurtz S, Ramirez L, Eastman J, Dukes R-M, Kapur P, DeRamus TP, 2016. Novel verbal fluency scores and structural brain imaging for prediction of cognitive outcome in mild cognitive impairment. Alzheimer’s Dementia: Diagnosis, Assessment & Disease Monitoring 2, 113–122. [DOI] [PMC free article] [PubMed] [Google Scholar]
- Cui Y, Sachdev PS, Lipnicki DM, Jin JS, Luo S, Zhu W, Kochan NA, Reppermund S, Liu T, Trollor JN, Brodaty H, Wen W, 2012. Predicting the development of mild cognitive impairment: a new use of pattern recognition. Neuroimage 60 (2), 894–901. 10.1016/j.neuroimage.2012.01.084. [DOI] [PubMed] [Google Scholar]
- Delong ER, Delong DM, Clarkepearson DI, 1988. Comparing the areas under 2 or more correlated receiver operating characteristic curves - a Nonparametric approach. Biometrics 44 (3), 837–845. [PubMed] [Google Scholar]
- Desikan RS, Segonne F, Fischl B, Quinn BT, Dickerson BC, Blacker D, Buckner RL, Dale AM, Maguire RP, Hyman BT, Albert MS, Killiany RJ, 2006. An automated labeling system for subdividing the human cerebral cortex on MRI scans into gyral based regions of interest. Neuroimage 31 (3), 968–980. 10.1016/j.neuroimage.2006.01.021. [DOI] [PubMed] [Google Scholar]
- Dietterich TG, 2000. An experimental comparison of three methods for constructing ensembles of decision trees: Bagging, boosting, and randomization. Mach. Learn 40 (2), 139–157. [Google Scholar]
- Dimitriadis SI, Liparas D, Alzheimer’s Disease Neuroimaging I., 2018. How random is the random forest? Random forest algorithm on the service of structural imaging biomarkers for Alzheimer’s disease: from Alzheimer’s disease neuroimaging initiative (ADNI) database. Neural Regen Res 13 (6), 962–970. 10.4103/1673-5374.233433. [DOI] [PMC free article] [PubMed] [Google Scholar]
- Ehrenberg AJ, Nguy AK, Theofilas P, Dunlop S, Suemoto CK, Di Lorenzo Alho AT, Leite RP, Diehl Rodriguez R, Mejia MB, Rub U, Farfel JM, de Lucena Ferretti-Rebustini RE, Nascimento CF, Nitrini R, Pasquallucci CA, Jacob-Filho W, Miller B, Seeley WW, Heinsen H, Grinberg LT, 2017. Quantifying the accretion of hyperphosphorylated tau in the locus coeruleus and dorsal raphe nucleus: the pathological building blocks of early Alzheimer’s disease. Neuropathol. Appl. Neurobiol 43 (5), 393–408. 10.1111/nan.12387. [DOI] [PMC free article] [PubMed] [Google Scholar]
- Ewers M, Walsh C, Trojanowski JQ, Shaw LM, Petersen RC, Jack CR Jr., Feldman HH, Bokde AL, Alexander GE, Scheltens P, Vellas B, Dubois B, Weiner M, Hampel H, North American Alzheimer’s Disease Neuroimaging, I., 2012. Prediction of conversion from mild cognitive impairment to Alzheimer’s disease dementia based upon biomarkers and neuropsychological test performance. Neurobiol. Aging 33 (7), 1203–1214. 10.1016/j.neurobiolaging.2010.10.019. [DOI] [PMC free article] [PubMed] [Google Scholar]
- Ezzati A, Harvey DJ, Habeck C, Golzar A, Qureshi IA, Zammit AR, Hyun J, Truelove-Hill M, Hall CB, Davatzikos C, Lipton RB, Alzheimer’s Disease Neuroimaging I., 2020. Predicting amyloid-beta levels in amnestic mild cognitive impairment using machine learning techniques. J Alzheimers Dis 73 (3), 1211–1219. 10.3233/JAD-191038. [DOI] [PMC free article] [PubMed] [Google Scholar]
- Falahati F, Westman E, Simmons A, 2014. Multivariate data analysis and machine learning in Alzheimer’s disease with a focus on structural magnetic resonance imaging. J. Alzheim. Dis 41 (3), 685–708. [DOI] [PubMed] [Google Scholar]
- Fernandez-Delgado M, Cernadas E, Barro S, Amorim D, 2014. Do we need hundreds of classifiers to solve real world classification problems? J. Mach. Learn. Res 15, 3133–3181. [Google Scholar]
- Grassi M, Rouleaux N, Caldirola D, Loewenstein D, Schruers K, Perna G, Dumontier M, Alzheimer’s Disease Neuroimaging I., 2019. A novel ensemble-based machine learning algorithm to predict the conversion from mild cognitive impairment to Alzheimer’s disease using socio-demographic characteristics, clinical information, and neuropsychological measures. Front. Neurol 10, 756. 10.3389/fneur.2019.00756. [DOI] [PMC free article] [PubMed] [Google Scholar]
- Gray KR, Aljabar P, Heckemann RA, Hammers A, Rueckert D, Alzheimer’s Disease Neuroimaging I., 2013. Random forest-based similarity measures for multimodal classification of Alzheimer’s disease. Neuroimage 65, 167–175. 10.1016/j.neuroimage.2012.09.065. [DOI] [PMC free article] [PubMed] [Google Scholar]
- Haghighi M, Smith A, Morgan D, Small B, Huang S, 2015. Identifying cost-effective predictive rules of amyloid-beta level by integrating neuropsychological tests and plasma-based markers. J Alzheimers Dis 43 (4), 1261–1270. 10.3233/JAD-140705. [DOI] [PubMed] [Google Scholar]
- Hebert LE, Weuve J, Scherr PA, Evans DA, 2013. Alzheimer disease in the United States (2010–2050) estimated using the 2010 census. Neurology 80 (19), 1778–1783. 10.1212/WNL.0b013e31828726f5. [DOI] [PMC free article] [PubMed] [Google Scholar]
- Holdstock JS, Mayes AR, Gong QY, Roberts N, Kapur N, 2005. Item recognition is less impaired than recall and associative recognition in a patient with selective hippocampal damage. Hippocampus 15 (2), 203–215. 10.1002/hipo.20046. [DOI] [PubMed] [Google Scholar]
- Holdstock JS, Mayes AR, Roberts N, Cezayirli E, Isaac CL, O’Reilly RC, Norman KA, 2002. Under what conditions is recognition spared relative to recall after selective hippocampal damage in humans? Hippocampus 12 (3), 341–351. 10.1002/hipo.10011. [DOI] [PubMed] [Google Scholar]
- Holm S, 1979. A simple sequentially rejective multiple test procedure. Scand. J. Stat 65–70. [Google Scholar]
- Hyman BT, Marzloff K, Arriagada PV, 1993. The lack of accumulation of senile plaques or amyloid burden in Alzheimer’s disease suggests a dynamic balance between amyloid deposition and resolution. J. Neuropathol. Exp. Neurol 52 (6), 594–600. 10.1097/00005072-199311000-00006. [DOI] [PubMed] [Google Scholar]
- Hyman BT, Tanzi RE, 1992. Amyloid, dementia and Alzheimer’s disease. Curr. Opin. Neurol. Neurosurg 5 (1), 88–93. https://www.ncbi.nlm.nih.gov/pubmed/1623244. [PubMed] [Google Scholar]
- Ibrahim B, Suppiah S, Ibrahim N, Mohamad M, Hassan HA, Nasser NS, Saripan MI, 2021. Diagnostic power of resting-state fMRI for detection of network connectivity in Alzheimer’s disease and mild cognitive impairment: a systematic review. Hum. Brain Mapp 42 (9), 2941–2968. 10.1002/hbm.25369. [DOI] [PMC free article] [PubMed] [Google Scholar]
- Ingelsson M, Fukumoto H, Newell KL, Growdon JH, Hedley-Whyte ET, Frosch MP, Albert MS, Hyman BT, Irizarry MC, 2004. Early Abeta accumulation and progressive synaptic loss, gliosis, and tangle formation in AD brain. Neurology 62 (6), 925–931. 10.1212/01.wnl.0000115115.98960.37. [DOI] [PubMed] [Google Scholar]
- Jack CR Jr., Holtzman DM, 2013. Biomarker modeling of Alzheimer’s disease. Neuron 80 (6), 1347–1358. 10.1016/j.neuron.2013.12.003. [DOI] [PMC free article] [PubMed] [Google Scholar]
- Jack CR Jr., Knopman DS, Jagust WJ, Petersen RC, Weiner MW, Aisen PS, Shaw LM, Vemuri P, Wiste HJ, Weigand SD, Lesnick TG, Pankratz VS, Donohue MC, Trojanowski JQ, 2013. Tracking pathophysiological processes in Alzheimer’s disease: an updated hypothetical model of dynamic biomarkers. Lancet Neurol. 12 (2), 207–216. 10.1016/S1474-4422(12)70291-0. [DOI] [PMC free article] [PubMed] [Google Scholar]
- Jacobs HIL, Becker JA, Kwong K, Engels-Dominguez N, Prokopiou PC, Papp KV, Properzi M, Hampton OL, d’Oleire Uquillas F, Sanchez JS, Rentz DM, El Fakhri G, Normandin MD, Price JC, Bennett DA, Sperling RA, Johnson KA, 2021. In vivo and neuropathology data support locus coeruleus integrity as indicator of Alzheimer’s disease pathology and cognitive decline. Sci. Transl. Med 13 (612) 10.1126/scitranslmed.abj2511eabj2511. [DOI] [PMC free article] [PubMed] [Google Scholar]
- Jansen WJ, Ossenkoppele R, Knol DL, Tijms BM, Scheltens P, Verhey FR, Visser PJ, Amyloid Biomarker Study G., Aalten P, Aarsland D, Alcolea D, Alexander M, Almdahl IS, Arnold SE, Baldeiras I, Barthel H, van Berckel BN, Bibeau K, Blennow K, Brooks DJ, van Buchem MA, Camus V, Cavedo E, Chen K, Chetelat G, Cohen AD, Drzezga A, Engelborghs S, Fagan AM, Fladby T, Fleisher AS, van der Flier WM, Ford L, Forster S, Fortea J, Foskett N, Frederiksen KS, Freund-Levi Y, Frisoni GB, Froelich L, Gabryelewicz T, Gill KD, Gkatzima O, Gomez-Tortosa E, Gordon MF, Grimmer T, Hampel H, Hausner L, Hellwig S, Herukka SK, Hildebrandt H, Ishihara L, Ivanoiu A, Jagust WJ, Johannsen P, Kandimalla R, Kapaki E, Klimkowicz-Mrowiec A, Klunk WE, Kohler S, Koglin N, Kornhuber J, Kramberger MG, Van Laere K, Landau SM, Lee DY, de Leon M, Lisetti V, Lleo A, Madsen K, Maier W, Marcusson J, Mattsson N, de Mendonca A, Meulenbroek O, Meyer PT, Mintun MA, Mok V, Molinuevo JL, Mollergard HM, Morris JC, Mroczko B, Van der Mussele S, Na DL, Newberg A, Nordberg A, Nordlund A, Novak GP, Paraskevas GP, Parnetti L, Perera G, Peters O, Popp J, Prabhakar S, Rabinovici GD, Ramakers IH, Rami L, Resende de Oliveira C, Rinne JO, Rodrigue KM, Rodriguez-Rodriguez E, Roe CM, Rot U, Rowe CC, Ruther E, Sabri O, Sanchez-Juan P, Santana I, Sarazin M, Schroder J, Schutte C, Seo SW, Soetewey F, Soininen H, Spiru L, Struyfs H, Teunissen CE, Tsolaki M, Vandenberghe R, Verbeek MM, Villemagne VL, Vos SJ, van Waalwijk van Doorn LJ, Waldemar G, Wallin A, Wallin AK, Wiltfang J, Wolk DA, Zboch M, Zetterberg H, 2015. Prevalence of cerebral amyloid pathology in persons without dementia: a meta-analysis. JAMA 313 (19), 1924–1938. 10.1001/jama.2015.4668. [DOI] [PMC free article] [PubMed] [Google Scholar]
- Jutten RJ, Rentz DM, Fu JF, Mayblyum DV, Amariglio RE, Buckley RF, Properzi MJ, Maruff P, Stark CE, Yassa MA, Johnson KA, Sperling RA, Papp KV, 2021a. Monthly at-home computerized cognitive testing to detect diminished practice effects in preclinical Alzheimer’s disease. Front. Aging Neurosci 13, 800126 10.3389/fnagi.2021.800126. [DOI] [PMC free article] [PubMed] [Google Scholar]
- Kandel BM, Avants BB, Gee JC, Arnold SE, Wolk DA, Alzheimer’s Disease Neuroimaging I., 2015. Neuropsychological testing predicts cerebrospinal fluid amyloid-beta in mild cognitive impairment. J Alzheimers Dis 46 (4), 901–912. 10.3233/JAD-142943. [DOI] [PMC free article] [PubMed] [Google Scholar]
- Kim JP, Kim J, Jang H, Kim J, Kang SH, Kim JS, Lee J, Na DL, Kim HJ, Seo SW, 2021. Predicting amyloid positivity in patients with mild cognitive impairment using a radiomics approach. Sci. Rep 11 (1), 1–9. [DOI] [PMC free article] [PubMed] [Google Scholar]
- Kim SE, Woo S, Kim SW, Chin J, Kim HJ, Lee BI, Park J, Park KW, Kang DY, Noh Y, Ye BS, Yoo HS, Lee JS, Kim Y, Kim SJ, Cho SH, Na DL, Lockhart SN, Jang H, Seo SW, 2018. A Nomogram for predicting amyloid PET positivity in amnestic mild cognitive impairment. J Alzheimers Dis 66 (2), 681–691. 10.3233/JAD-180048. [DOI] [PubMed] [Google Scholar]
- Landau SM, Breault C, Joshi AD, Pontecorvo M, Mathis CA, Jagust WJ, Mintun MA, 2013. Amyloid-beta imaging with Pittsburgh compound B and florbetapir: comparing radiotracers and quantification methods. J. Nucl. Med 54 (1), 70–77. 10.2967/jnumed.112.109009. [DOI] [PMC free article] [PubMed] [Google Scholar]
- Landau SM, Mintun MA, Joshi AD, Koeppe RA, Petersen RC, Aisen PS, Weiner MW, Jagust WJ, 2012. Amyloid deposition, hypometabolism, and longitudinal cognitive decline. Ann. Neurol 72 (4), 578–586. 10.1002/ana.23650. [DOI] [PMC free article] [PubMed] [Google Scholar]
- Leal SL, Yassa MA, 2014. Effects of aging on mnemonic discrimination of emotional information. Behav. Neurosci 128 (5), 539–547. 10.1037/bne0000011. [DOI] [PMC free article] [PubMed] [Google Scholar]
- Lebedeva AK, Westman E, Borza T, Beyer MK, Engedal K, Aarsland D, Selbaek G, Haberg AK, 2017. MRI-based classification models in prediction of mild cognitive impairment and dementia in late-life depression. Front. Aging Neurosci 9, 13. 10.3389/fnagi.2017.00013. [DOI] [PMC free article] [PubMed] [Google Scholar]
- Leifer BP, 2003. Early diagnosis of Alzheimer’s disease: clinical and economic benefits. J. Am. Geriatr. Soc 51 (5 Suppl. Dementia), S281–S288. 10.1046/j.1532-5415.5153.x. [DOI] [PubMed] [Google Scholar]
- Leutgeb S, Leutgeb JK, Treves A, Moser MB, Moser EI, 2004. Distinct ensemble codes in hippocampal areas CA3 and CA1. Science 305 (5688), 1295–1298. 10.1126/science.1100265. [DOI] [PubMed] [Google Scholar]
- Mayes AR, Holdstock JS, Isaac CL, Hunkin NM, Roberts N, 2002. Relative sparing of item recognition memory in a patient with adult-onset damage limited to the hippocampus. Hippocampus 12 (3), 325–340. 10.1002/hipo.1111. [DOI] [PubMed] [Google Scholar]
- Migo E, Montaldi D, Norman KA, Quamme J, Mayes A, 2009. The contribution of familiarity to recognition memory is a function of test format when using similar foils. Q. J. Exp. Psychol 62 (6), 1198–1215. 10.1080/17470210802391599. [DOI] [PMC free article] [PubMed] [Google Scholar]
- Moradi E, Pepe A, Gaser C, Huttunen H, Tohka J, 2015. Machine learning framework for early MRI-based Alzheimer’s conversion prediction in MCI subjects. Neuroimage 104, 398–412. 10.1016/j.neuroimage.2014.10.002. [DOI] [PMC free article] [PubMed] [Google Scholar]
- Ownby RL, Crocco E, Acevedo A, John V, Loewenstein D, 2006. Depression and risk for Alzheimer disease: systematic review, meta-analysis, and metaregression analysis. Arch. Gen. Psychiatr 63 (5), 530–538. 10.1001/archpsyc.63.5.530. [DOI] [PMC free article] [PubMed] [Google Scholar]
- Palmqvist S, Insel PS, Zetterberg H, Blennow K, Brix B, Stomrud E, Alzheimer’s Disease Neuroimaging I., Swedish Bio F.s., Mattsson N, Hansson O, 2019. Accurate risk estimation of beta-amyloid positivity to identify prodromal Alzheimer’s disease: cross-validation study of practical algorithms. Alzheimers Dement 15 (2), 194–204. 10.1016/j.jalz.2018.08.014. [DOI] [PMC free article] [PubMed] [Google Scholar]
- Papp KV, Rentz DM, Maruff P, Sun CK, Raman R, Donohue MC, Schembri A, Stark C, Yassa MA, Wessels AM, Yaari R, Holdridge KC, Aisen PS, Sperling RA, 2021. The computerized cognitive composite (C3) in an Alzheimer’s disease secondary prevention trial. J Prev Alzheimers Dis 8 (1), 59–67. 10.14283/jpad.2020.38. [DOI] [PMC free article] [PubMed] [Google Scholar]
- Pedregosa F, Varoquaux G, Gramfort A, Michel V, Thirion B, Grisel O, Blondel M, Prettenhofer P, Weiss R, Dubourg V, Vanderplas J, Passos A, Cournapeau D, Brucher M, Perrot M, Duchesnay E, 2011. Scikit-learn: machine learning in Python. J. Mach. Learn. Res 12, 2825–2830. [Google Scholar]
- Peirce JW, 2007. PsychoPy–Psychophysics software in Python. J. Neurosci. Methods 162 (1–2), 8–13. 10.1016/j.jneumeth.2006.11.017. [DOI] [PMC free article] [PubMed] [Google Scholar]
- Perez-Nievas BG, Stein TD, Tai HC, Dols-Icardo O, Scotton TC, Barroeta-Espar I, Fernandez-Carballo L, de Munain EL, Perez J, Marquie M, Serrano-Pozo A, Frosch MP, Lowe V, Parisi JE, Petersen RC, Ikonomovic MD, Lopez OL, Klunk W, Hyman BT, Gomez-Isla T, 2013. Dissecting phenotypic traits linked to human resilience to Alzheimer’s pathology. Brain 136 (Pt 8), 2510–2526. 10.1093/brain/awt171. [DOI] [PMC free article] [PubMed] [Google Scholar]
- Petersen RC, Doody R, Kurz A, Mohs RC, Morris JC, Rabins PV, Ritchie K, Rossor M, Thal L, Winblad B, 2001. Current concepts in mild cognitive impairment. Arch. Neurol 58 (12), 1985–1992. [DOI] [PubMed] [Google Scholar]
- Pini L, Pievani M, Bocchetta M, Altomare D, Bosco P, Cavedo E, Galluzzi S, Marizzoni M, Frisoni GB, 2016. Brain atrophy in Alzheimer’s Disease and aging. Ageing Res. Rev 30, 25–48. 10.1016/j.arr.2016.01.002. [DOI] [PubMed] [Google Scholar]
- Puttaert D, Coquelet N, Wens V, Peigneux P, Fery P, Rovai A, Trotta N, Sadeghi N, Coolen T, Bier JC, Goldman S, De Tiege X, 2020. Alterations in resting-state network dynamics along the Alzheimer’s disease continuum. Sci. Rep 10 (1), 21990 10.1038/s41598-020-76201-3. [DOI] [PMC free article] [PubMed] [Google Scholar]
- Quigley H, Colloby SJ, O’Brien JT, 2011. PET imaging of brain amyloid in dementia: a review. Int. J. Geriatr. Psychiatr 26 (10), 991–999. 10.1002/gps.2640. [DOI] [PubMed] [Google Scholar]
- Ranganath C, Ritchey M, 2012. Two cortical systems for memory-guided behaviour. Nat. Rev. Neurosci 13 (10), 713–726. 10.1038/nrn3338. [DOI] [PubMed] [Google Scholar]
- Reagh ZM, Ho HD, Leal SL, Noche JA, Chun A, Murray EA, Yassa MA, 2016. Greater loss of object than spatial mnemonic discrimination in aged adults. Hippocampus 26 (4), 417–422. 10.1002/hipo.22562. [DOI] [PMC free article] [PubMed] [Google Scholar]
- Reagh ZM, Noche JA, Tustison NJ, Delisle D, Murray EA, Yassa MA, 2018. Functional imbalance of Anterolateral entorhinal cortex and hippocampal dentate/CA3 underlies age-related object pattern separation deficits. Neuron 97 (5), 1187–1198 e1184. 10.1016/j.neuron.2018.01.039. [DOI] [PMC free article] [PubMed] [Google Scholar]
- Reagh ZM, Roberts JM, Ly M, DiProspero N, Murray E, Yassa MA, 2014. Spatial discrimination deficits as a function of mnemonic interference in aged adults with and without memory impairment. Hippocampus 24 (3), 303–314. 10.1002/hipo.22224. [DOI] [PMC free article] [PubMed] [Google Scholar]
- Reagh ZM, Yassa MA, 2014. Object and spatial mnemonic interference differentially engage lateral and medial entorhinal cortex in humans. Proc. Natl. Acad. Sci. U. S. A 111 (40), E4264–E4273. 10.1073/pnas.1411250111. [DOI] [PMC free article] [PubMed] [Google Scholar]
- Sarica A, Cerasa A, Quattrone A, 2017. Random forest algorithm for the classification of neuroimaging data in Alzheimer’s disease: a systematic review. Front. Aging Neurosci 9, 329. 10.3389/fnagi.2017.00329. [DOI] [PMC free article] [PubMed] [Google Scholar]
- Savage RM, Gouvier WD, 1992. Rey Auditory-Verbal Learning Test: the effects of age and gender, and norms for delayed recall and story recognition trials. Arch. Clin. Neuropsychol 7 (5), 407–414. https://www.ncbi.nlm.nih.gov/pubmed/14591275. [PubMed] [Google Scholar]
- Snodgrass JG, Corwin J, 1988. Pragmatics of measuring recognition memory: applications to dementia and amnesia. J. Exp. Psychol. Gen 117 (1), 34. [DOI] [PubMed] [Google Scholar]
- Spasov S, Passamonti L, Duggento A, Lio P, Toschi N, 2019. A parameter-efficient deep learning approach to predict conversion from mild cognitive impairment to Alzheimer’s disease. Neuroimage 189, 276–287. 10.1016/j.neuroimage.2019.01.031. [DOI] [PubMed] [Google Scholar]
- Sperling RA, Aisen PS, Beckett LA, Bennett DA, Craft S, Fagan AM, Iwatsubo T, Jack CR Jr., Kaye J, Montine TJ, Park DC, Reiman EM, Rowe CC, Siemers E, Stern Y, Yaffe K, Carrillo MC, Thies B, Morrison-Bogorad M, Wagster MV, Phelps CH, 2011. Toward defining the preclinical stages of Alzheimer’s disease: recommendations from the National Institute on Aging-Alzheimer’s Association workgroups on diagnostic guidelines for Alzheimer’s disease. Alzheimers Dement 7 (3), 280–292. 10.1016/j.jalz.2011.03.003. [DOI] [PMC free article] [PubMed] [Google Scholar]
- Stark SM, Kirwan CB, Stark CEL, 2019. Mnemonic similarity task: a tool for assessing hippocampal integrity. Trends Cognit. Sci 23 (11), 938–951. 10.1016/j.tics.2019.08.003. [DOI] [PMC free article] [PubMed] [Google Scholar]
- Stark SM, Stark CEL, 2017. Age-related deficits in the mnemonic similarity task for objects and scenes. Behav. Brain Res 333, 109–117. 10.1016/j.bbr.2017.06.049. [DOI] [PMC free article] [PubMed] [Google Scholar]
- Stark SM, Yassa MA, Lacy JW, Stark CE, 2013. A task to assess behavioral pattern separation (BPS) in humans: data from healthy aging and mild cognitive impairment. Neuropsychologia 51 (12), 2442–2449. 10.1016/j.neuropsychologia.2012.12.014. [DOI] [PMC free article] [PubMed] [Google Scholar]
- Stephan BC, Hunter S, Harris D, Llewellyn DJ, Siervo M, Matthews FE, Brayne C, 2012. The neuropathological profile of mild cognitive impairment (MCI): a systematic review. Mol. Psychiatr 17 (11), 1056–1076. 10.1038/mp.2011.147. [DOI] [PubMed] [Google Scholar]
- Sun X, Xu WC, 2014. Fast Implementation of DeLong’s algorithm for comparing the areas under correlated receiver operating characteristic curves. IEEE Signal Process. Lett 21 (11), 1389–1393. 10.1109/Lsp.2014.2337313. [DOI] [Google Scholar]
- Suwabe K, Hyodo K, Byun K, Ochi G, Fukuie T, Shimizu T, Kato M, Yassa MA, Soya H, 2017. Aerobic fitness associates with mnemonic discrimination as a mediator of physical activity effects: evidence for memory flexibility in young adults. Sci. Rep 7 (1), 5140. 10.1038/s41598-017-04850-y. [DOI] [PMC free article] [PubMed] [Google Scholar]
- Thal DR, Rub U, Orantes M, Braak H, 2002. Phases of A beta-deposition in the human brain and its relevance for the development of AD. Neurology 58 (12), 1791–1800. 10.1212/wnl.58.12.1791. [DOI] [PubMed] [Google Scholar]
- Trelle AN, Carr VA, Wilson EN, Swarovski MS, Hunt MP, Toueg TN, Tran TT, Channappa D, Corso NK, Thieu MK, Jayakumar M, Nadiadwala A,Guo W, Tanner NJ, Bernstein JD, Litovsky CP, Guerin SA, Khazenzon AM, Harrison MB, Rutt BK, Deutsch GK, Chin FT, Davidzon GA, Hall JN, Sha SJ, Fredericks CA, Andreasson KI, Kerchner GA, Wagner AD, Mormino EC, 2021. Association of CSF biomarkers with hippocampal-dependent memory in preclinical Alzheimer disease. Neurology 96 (10), e1470–e1481. 10.1212/WNL.0000000000011477. [DOI] [PMC free article] [PubMed] [Google Scholar]
- van Dyck CH, Swanson CJ, Aisen P, Bateman RJ, Chen C, Gee M, Kanekiyo M, Li D, Reyderman L, Cohen S, Froelich L, Katayama S, Sabbagh M, Vellas B, Watson D, Dhadda S, Irizarry M, Kramer LD, Iwatsubo T, 2023. Lecanemab in early Alzheimer’s disease. N. Engl. J. Med 388 (1), 9–21. 10.1056/NEJMoa2212948. [DOI] [PubMed] [Google Scholar]
- Velazquez M, Lee Y, Alzheimer’s Disease Neuroimaging I., 2021. Random forest model for feature-based Alzheimer’s disease conversion prediction from early mild cognitive impairment subjects. PLoS One 16 (4), e0244773. 10.1371/journal.pone.0244773. [DOI] [PMC free article] [PubMed] [Google Scholar]
- Villemagne VL, Pike KE, Darby D, Maruff P, Savage G, Ng S, Ackermann U, Cowie TF, Currie J, Chan SG, Jones G, Tochon-Danguy H, O’Keefe G, Masters CL, Rowe CC, 2008. Abeta deposits in older non-demented individuals with cognitive decline are indicative of preclinical Alzheimer’s disease. Neuropsychologia 46 (6), 1688–1697. 10.1016/j.neuropsychologia.2008.02.008. [DOI] [PubMed] [Google Scholar]
- Wang C, Costanzo ME, Rapp PE, Darmon D, Bashirelahi K, Nathan DE, Cellucci CJ, Roy MJ, Keyser DO, 2017. Identifying Electrophysiological prodromes of post-traumatic stress disorder: results from a pilot study. Front. Psychiatr 8, 71. 10.3389/fpsyt.2017.00071. [DOI] [PMC free article] [PubMed] [Google Scholar]
- Webb CE, Foster CM, Horn MM, Kennedy KM, Rodrigue KM, 2020. Beta-amyloid burden predicts poorer mnemonic discrimination in cognitively normal older adults. Neuroimage 221, 117199. 10.1016/j.neuroimage.2020.117199. [DOI] [PMC free article] [PubMed] [Google Scholar]
- Weiner MW, Veitch DP, Aisen PS, Beckett LA, Cairns NJ, Green RC, Harvey D, Jack CR Jr., Jagust W, Morris JC, Petersen RC, Saykin AJ, Shaw LM, Toga AW, Trojanowski JQ, 2017. Recent publications from the Alzheimer’s Disease Neuroimaging Initiative: reviewing progress toward improved AD clinical trials. Alzheimers Dement 13 (4), e1–e85. 10.1016/j.jalz.2016.11.007. [DOI] [PMC free article] [PubMed] [Google Scholar]
- Weintraub S, Besser L, Dodge HH, Teylan M, Ferris S, Goldstein FC, Giordani B, Kramer J, Loewenstein D, Marson D, Mungas D, Salmon D, Welsh-Bohmer K, Zhou XH, Shirk SD, Atri A, Kukull WA, Phelps C, Morris JC, 2018. Janmar). Version 3 of the Alzheimer disease centers’ neuropsychological test battery in the Uniform data set (UDS). Alzheimer Dis. Assoc. Disord 32 (1), 10–17. 10.1097/WAD.0000000000000223. [DOI] [PMC free article] [PubMed] [Google Scholar]
- Yassa MA, Mattfeld AT, Stark SM, Stark CE, 2011. Age-related memory deficits linked to circuit-specific disruptions in the hippocampus. Proc. Natl. Acad. Sci. U. S. A 108 (21), 8873–8878. 10.1073/pnas.1101567108. [DOI] [PMC free article] [PubMed] [Google Scholar]
- Yassa MA, Stark SM, Bakker A, Albert MS, Gallagher M, Stark CE, 2010. High-resolution structural and functional MRI of hippocampal CA3 and dentate gyrus in patients with amnestic Mild Cognitive Impairment. Neuroimage 51 (3), 1242–1252. 10.1016/j.neuroimage.2010.03.040. [DOI] [PMC free article] [PubMed] [Google Scholar]
- Zeisel J, Bennett K, Fleming R, 2020. World Alzheimer Report 2020: Design, Dignity, Dementia: Dementia-Related Design and the Built Environment.
- Zhang D, Wang Y, Zhou L, Yuan H, Shen D, Alzheimer’s Disease Neuroimaging I., 2011. Multimodal classification of Alzheimer’s disease and mild cognitive impairment. Neuroimage 55 (3), 856–867. 10.1016/j.neuroimage.2011.01.008. [DOI] [PMC free article] [PubMed] [Google Scholar]
Associated Data
This section collects any data citations, data availability statements, or supplementary materials included in this article.
Supplementary Materials
Data Availability Statement
Data will be made available on request.