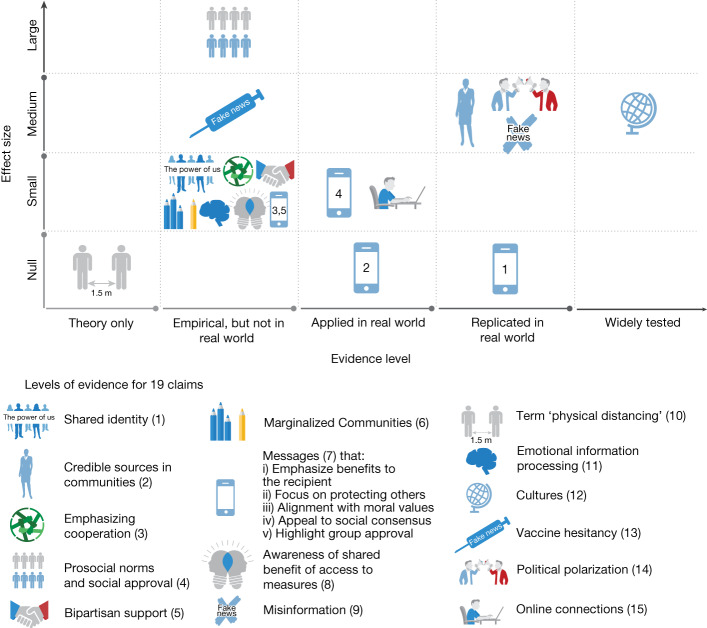
Fig. 1. Reviewer-assessed effect size for each claim and the qualitative rating.
The y axis shows the reviewer-assessed effect size for each claim; the x axis shows the qualitative rating (from theory only to widely tested). Each set of claims is represented by a different icon. Most claims were confirmed as having small-to-medium effect sizes, including those tested and replicated in real-world contexts. The strongest finding is indicated by the globe on the right, near the top, which shows the claim about culture (see Table 1) was widely tested in multiple studies and the results were consistent with the original Van Bavel et al. paper at roughly a medium effect size. A legend for each icon to represent the 19 claims is presented below the graph.

